Devlog #5 - Recent Graphics Improvements Roundup
Upgraded environments, volumetric clouds, borderless water reflections, order independent glass, HDR, DLSS 3, FSR 2, and more for Early Access.

Welcome back to another devlog! What do you mean it's been half a year since the last one? Time really flies. Anyway, today I want to show you all the graphics improvements and new features that I added over the past year. Of course these don't all come for free, but they can be quite nice on capable GPUs.
Mobile data warning: This page will load hundreds of MB of media as you scroll!
Overview
Having an index was quite useful on the last post, so let's do it again.
Introduction
Unreal Engine 5.3 and PhysX 5.3
Upgraded Dynamic Environments
Volumetric Clouds
New Environment Settings
Flat Earth Theory Disproven
Improved Screen Space Reflections
Bending Water Reflection Rays
Inexact Proto-Lumen Reflections
Final Result
Order Independent Glass
How Does That Work?
It's Never That Simple
Performance Testing
High Dynamic Range Output
New Upscaling Plugins
DLSS 3 Frame Generation
FSR 2 Upscaling
What about FSR 3?
Improved Level of Detail Transitions
Dithered Level of Detail Transitions
Improved Low Detail Brick Shapes
Combining Both Improvements
What's Next?
Introduction
Since our previous post was already about physics, it only makes sense for this one to focus on graphics again, right? There's a lot to discover in this one, from simple pretty pictures to technical details and views under the hood, debugging graphical problems, and more. I'm not a very experienced graphics programmer, so some of it is also just my personal curiosity to get some of these things to work. I think it will have something interesting for you regardless of whether you're waiting to play the game or working on your own projects :)
PS: This blog is not co-authored by ChatGPT! I actually tried to do that once, and it spewed unusable corporate-sounding garbage.
Unreal Engine 5.3 and PhysX 5.3
Since the last upgrade post, I've migrated the project from Unreal Engine 5.1 to 5.2 and then to 5.3, so now we are fully up to date again. Due to the amount of changes we have to the engine, each of these migrations is a massive task. I have to rebase tens of thousands of changes in hundreds of files to the new branch, fixing several hundred merge conflicts along the way. Somehow Epic likes to change the same files as us.

Those changes include our PhysX integration, now targeting PhysX 5.3 (isn't that number a funny coincidence?), which was originally based on a version of Epic's code in Unreal Engine 4 but somehow strays further from the beaten path with every upgrade. There are also many rendering and shader modifications, bug fixes, networking and performance improvements, ... and that's before we can start fixing all the new bugs we just added.
For example, Proto-Lumen had broken in multiple ways during this upgrade. It was no longer getting any velocity information, which I finally managed to track down to be caused by Epic having allowed async compute on NVIDIA GPUs for the first time in 5.3, causing Lumen to go down a different code path that was previously never used.
In this path, Lumen was not compatible with not having a depth pre-pass, because that'd result in velocity information only being generated after Lumen work had been dispatched. Brickadia does not have a depth pre-pass, because that actually slows down the rendering with lots of meshes and only simple shaders being used. Having to process thousands of draw calls and millions of vertices twice, perhaps unsurprisingly, doesn't make the game faster.
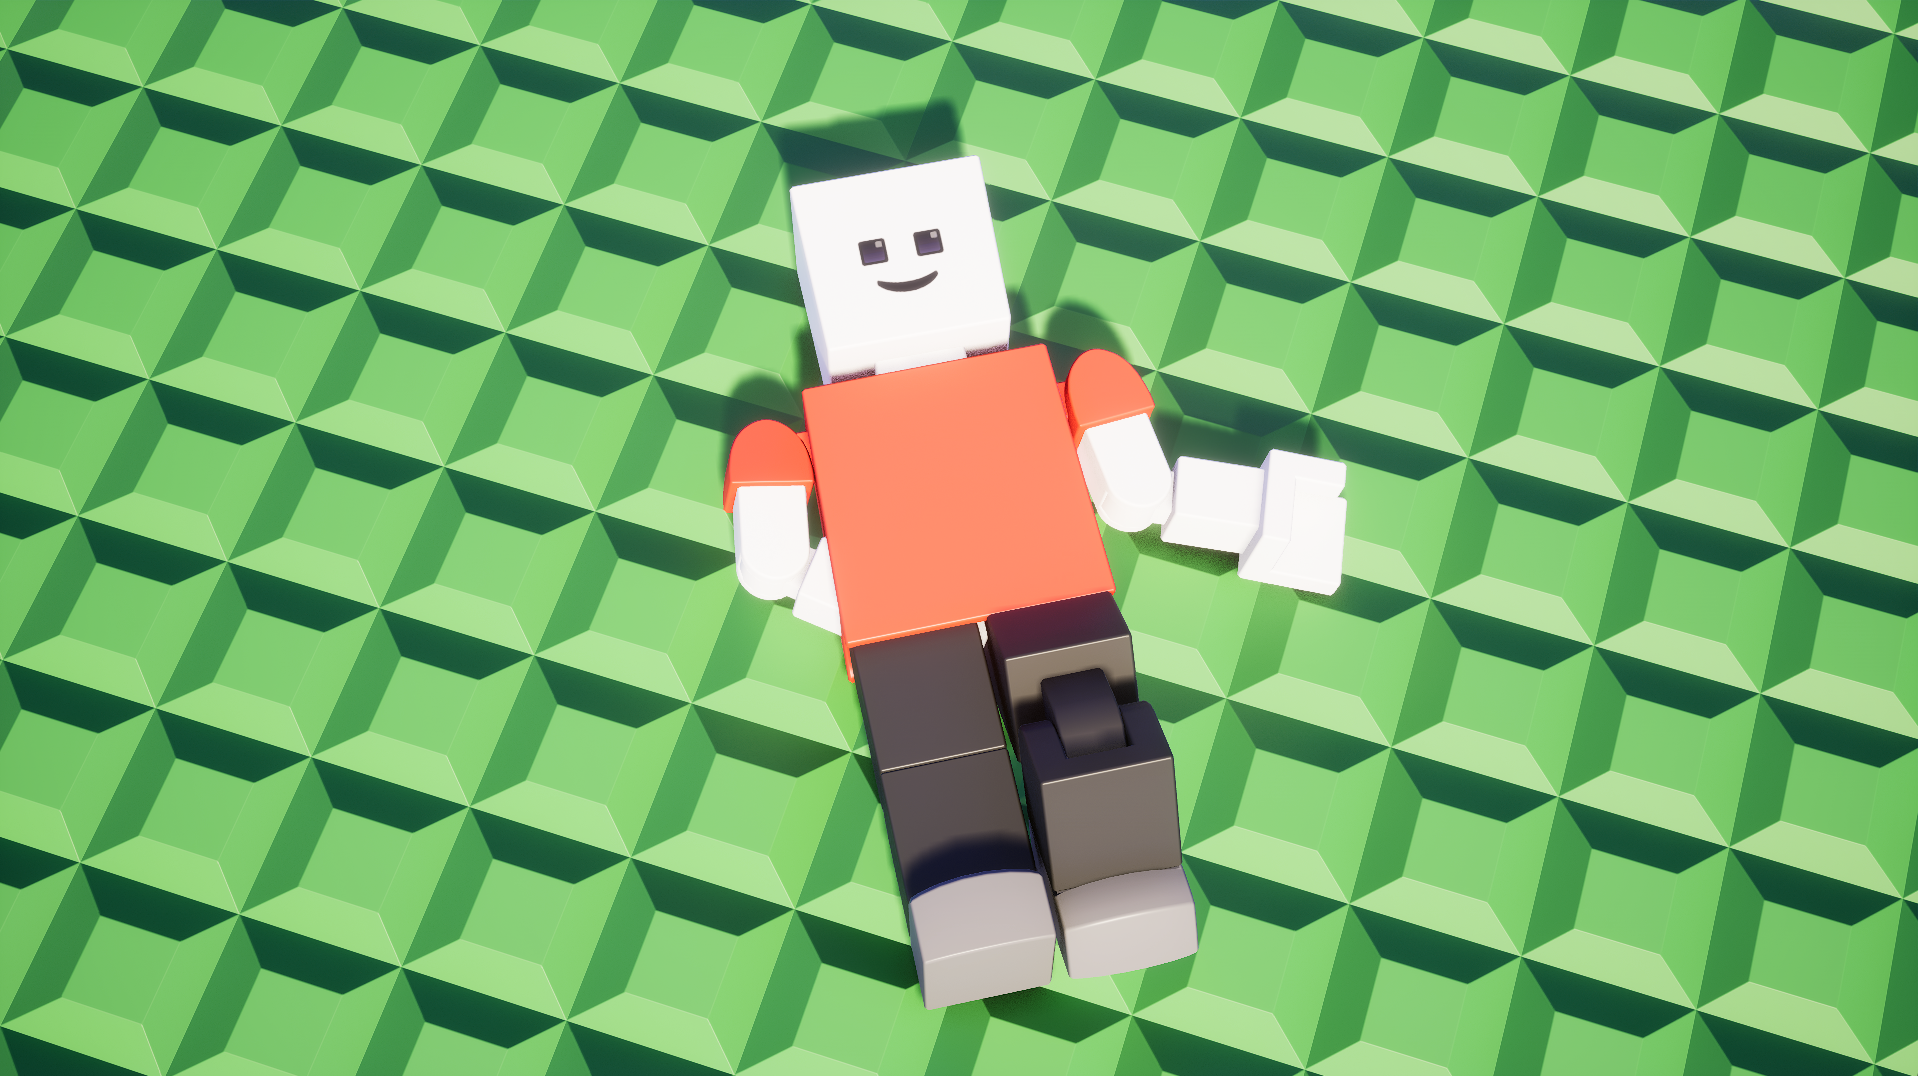
I tried to enable the early velocity pass so this data would be ready in time, but it turns out this does not work without the early depth pass. It produced clearly nonsensical velocity information, such as seeing the movement of the left hand through the body of the character, when it should be obscured.
In hindsight, this should have been the expected result with front to back draw order and no depth buffer, but it still took me quite a while to figure out the cause.
The final fix ended up being to move Lumen dispatch after the normal base pass and velocity were done. There were still more problems with Proto-Lumen, though, it was also flickering so terribly in the dark that I'd consider it unplayable.
Lots of tweaks later, this version of it seems much more stable.
We continue to have silly issues with our PhysX implementation too, seems something has changed with the joint axes in either PhysX or Unreal Engine.
On that note, I've received many requests from other indie developers if they could use our PhysX integration for other, non-competing projects. That sounds reasonable to me, but the changes have been slowly getting mixed up with other commits and fixes. Before we can share it, it would need to be separated out and cleaned up and tested more, and I don't currently know when there will be time.
At the moment, it doesn't even compile outside of the Brickadia project with its very specific set of enabled/disabled plugins and related changes.
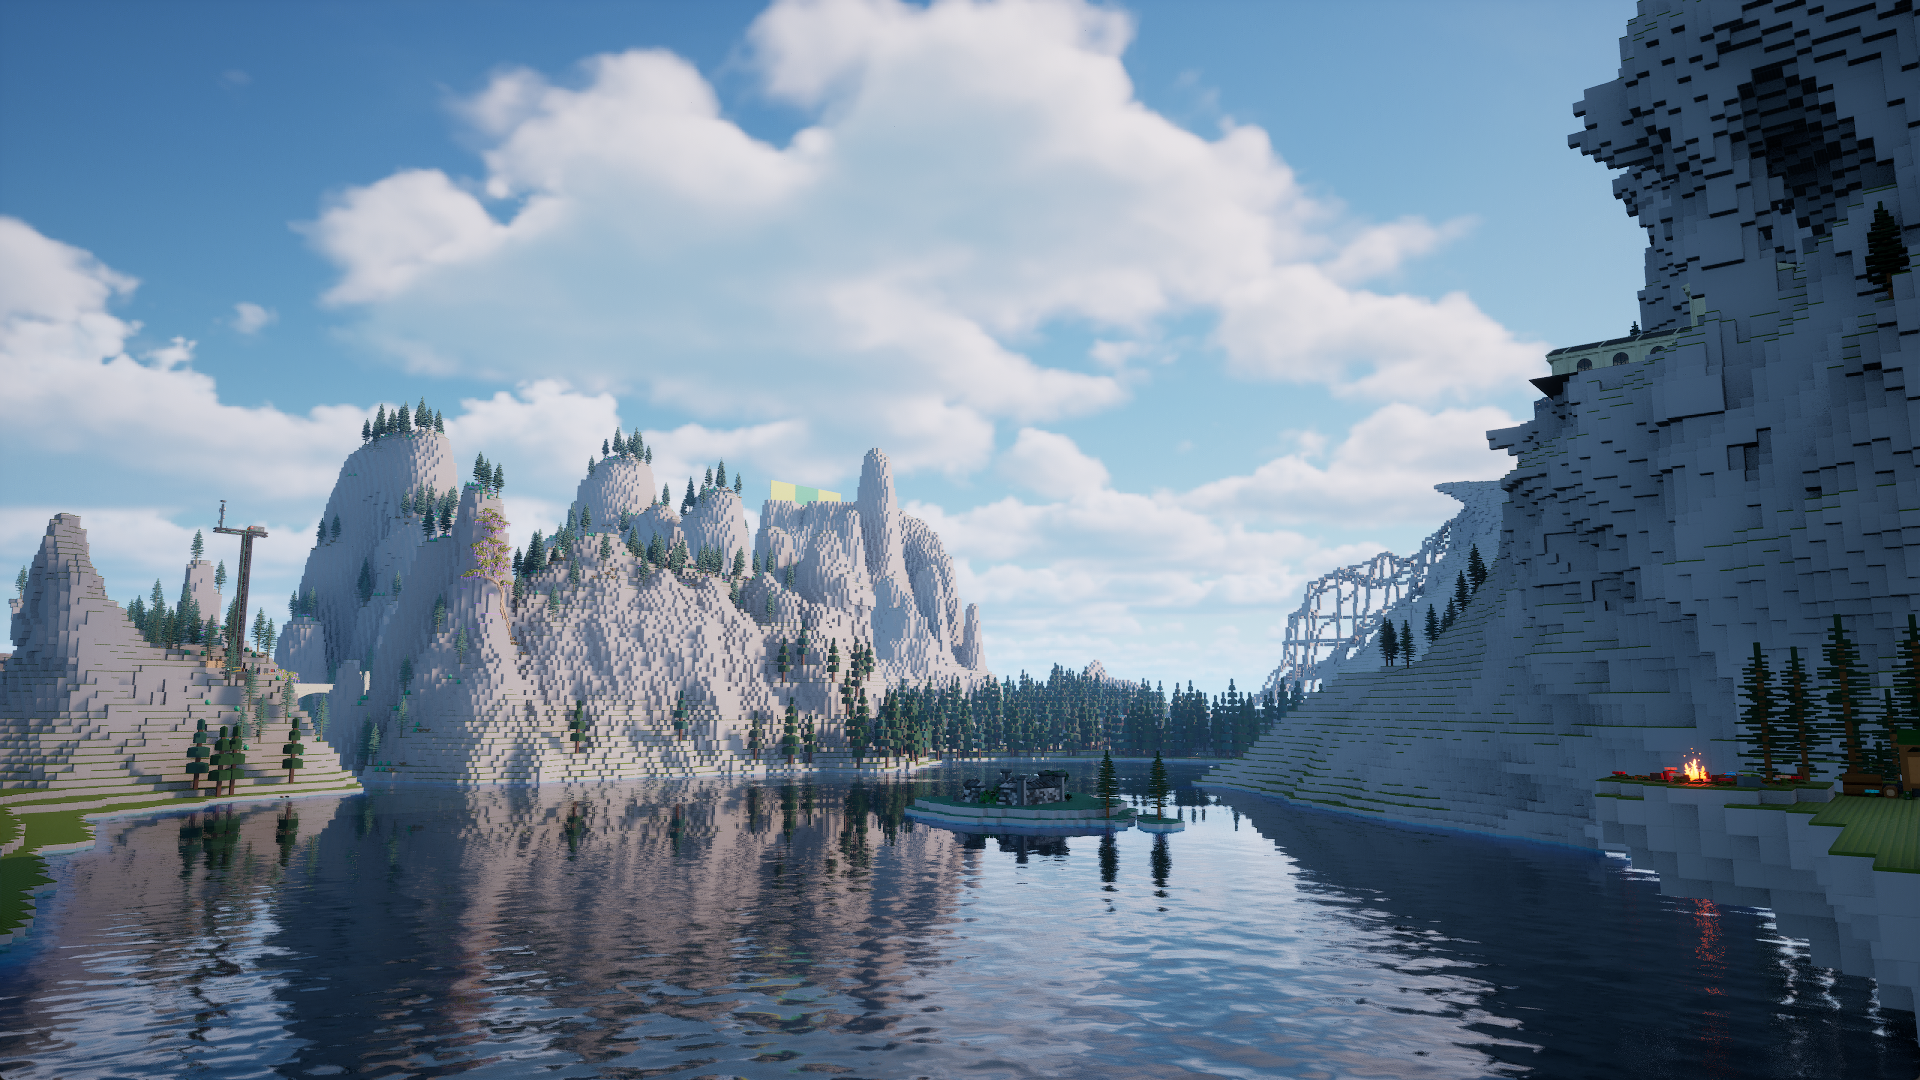
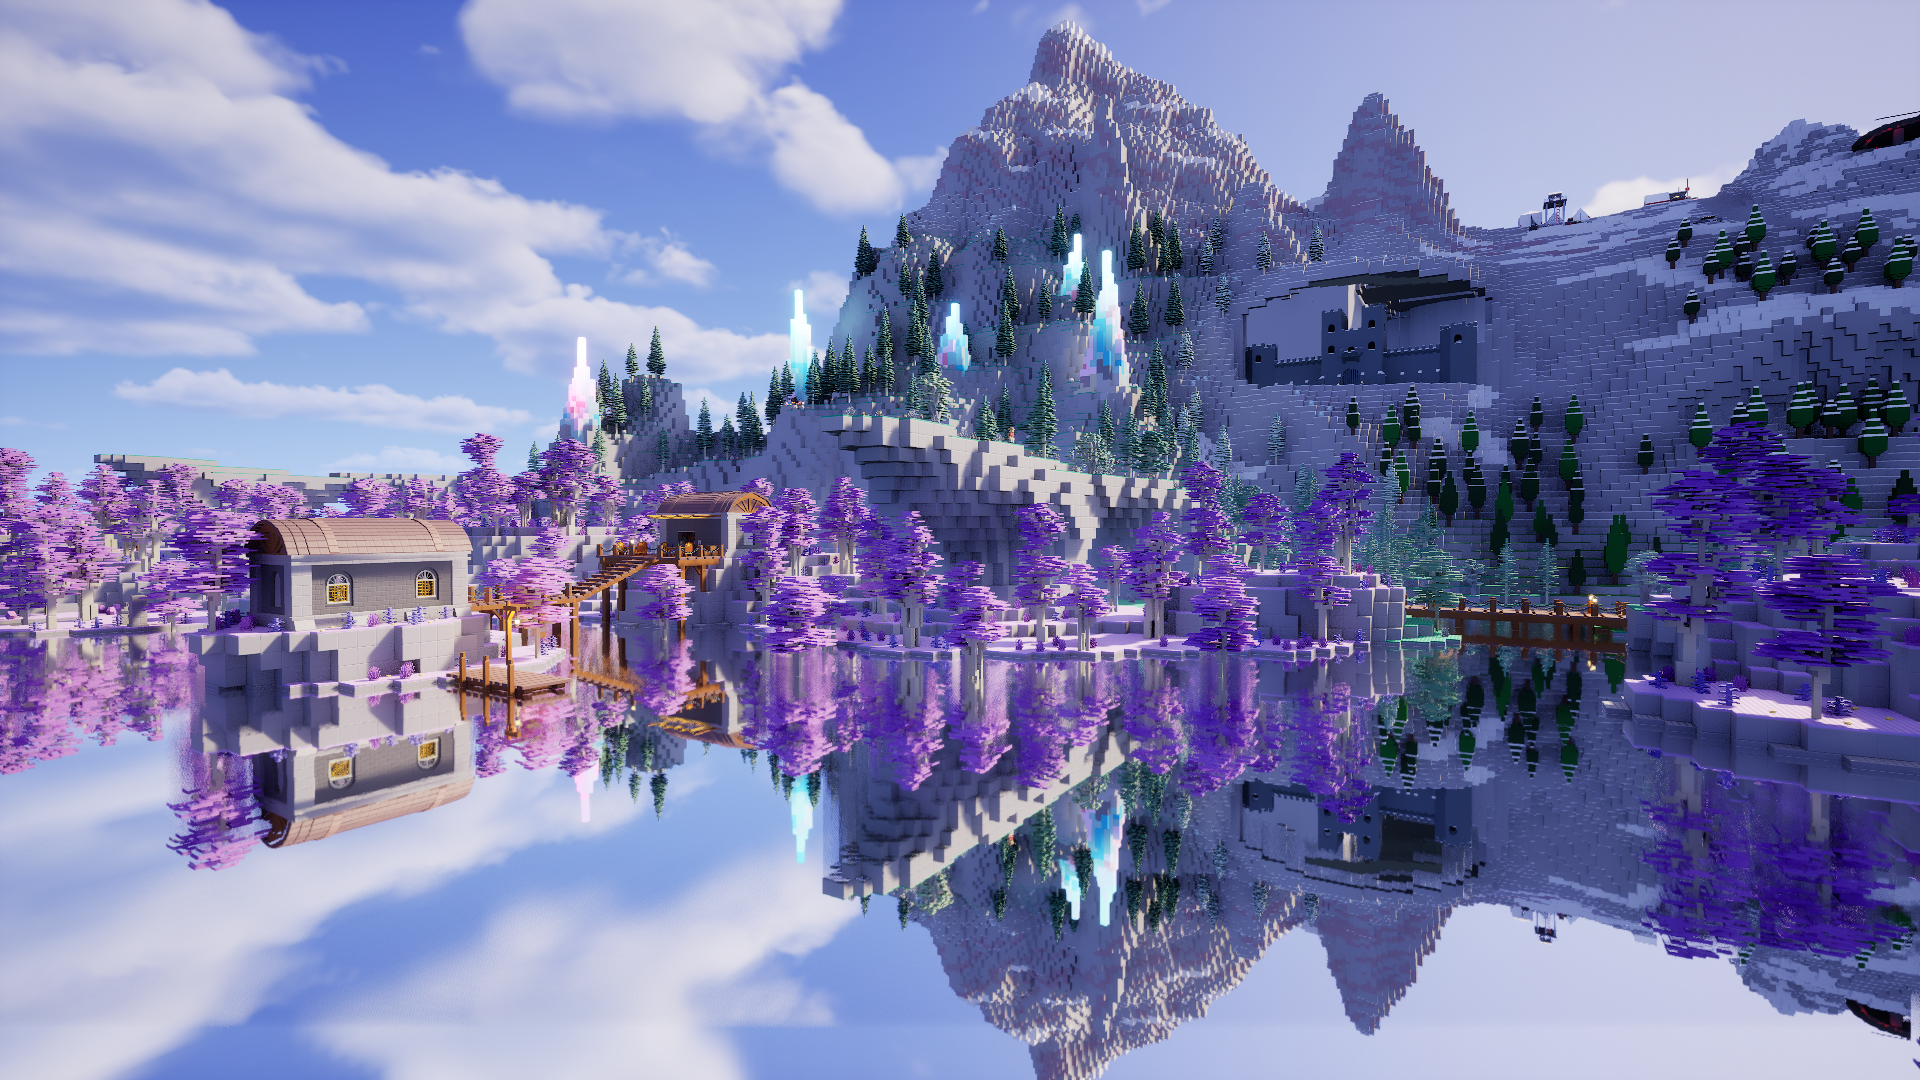
Upgraded Dynamic Environments
If you've been following our project or Unreal Engine in general for a while, you might have recognized that the customizable environment on Plate is powered by something called Ultra Dynamic Sky, which builds on the existing lighting and atmosphere simulation features in Unreal Engine. It also provides the weather effects we're using in the game currently. From there, we mostly optimize its performance, improve the look and colors, integrate it with our inspector system to allow you to customize it in multiplayer and create presets, control it with behavior scripts, etc. It's layers of abstraction all the way down!
However, for most of this time, we were using a very old version of it - several years behind by now. So, what if we modernized our maps a bit, and re-created the environments using the new version for Unreal Engine 5?
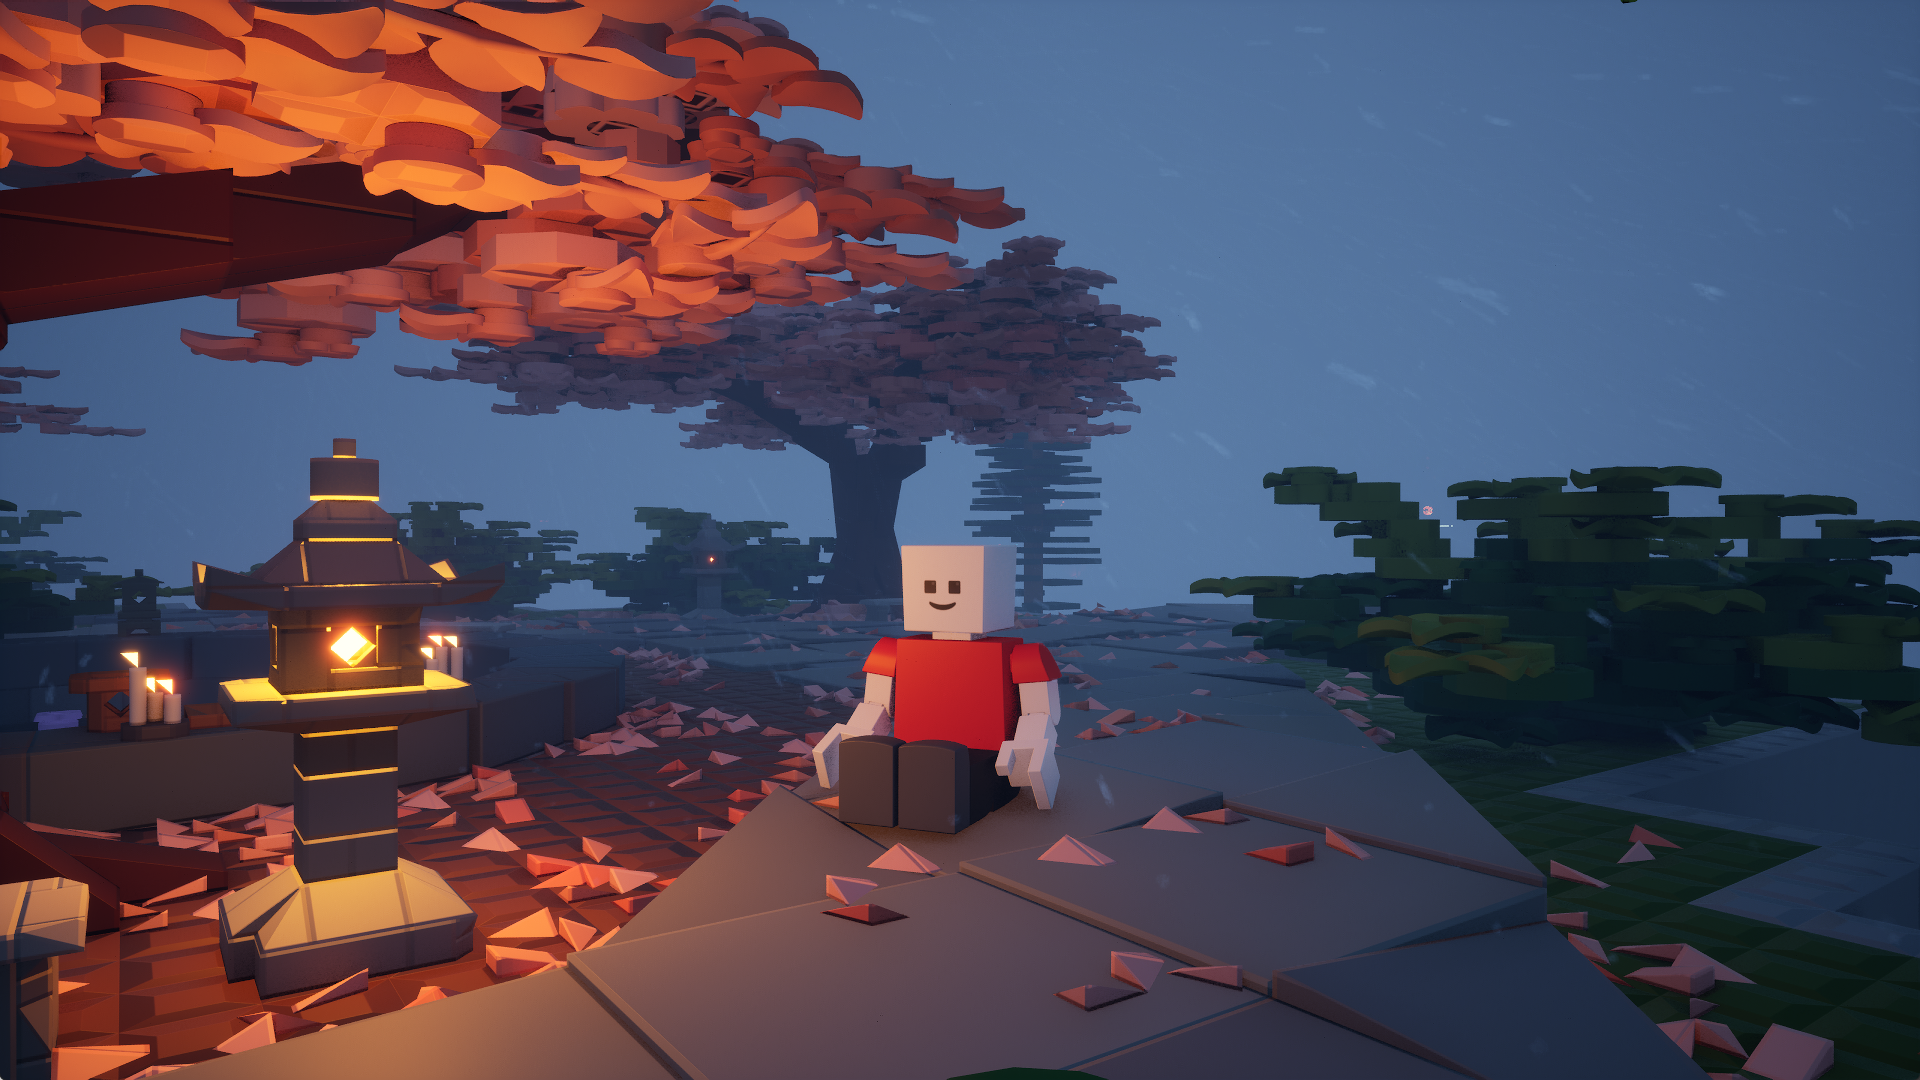
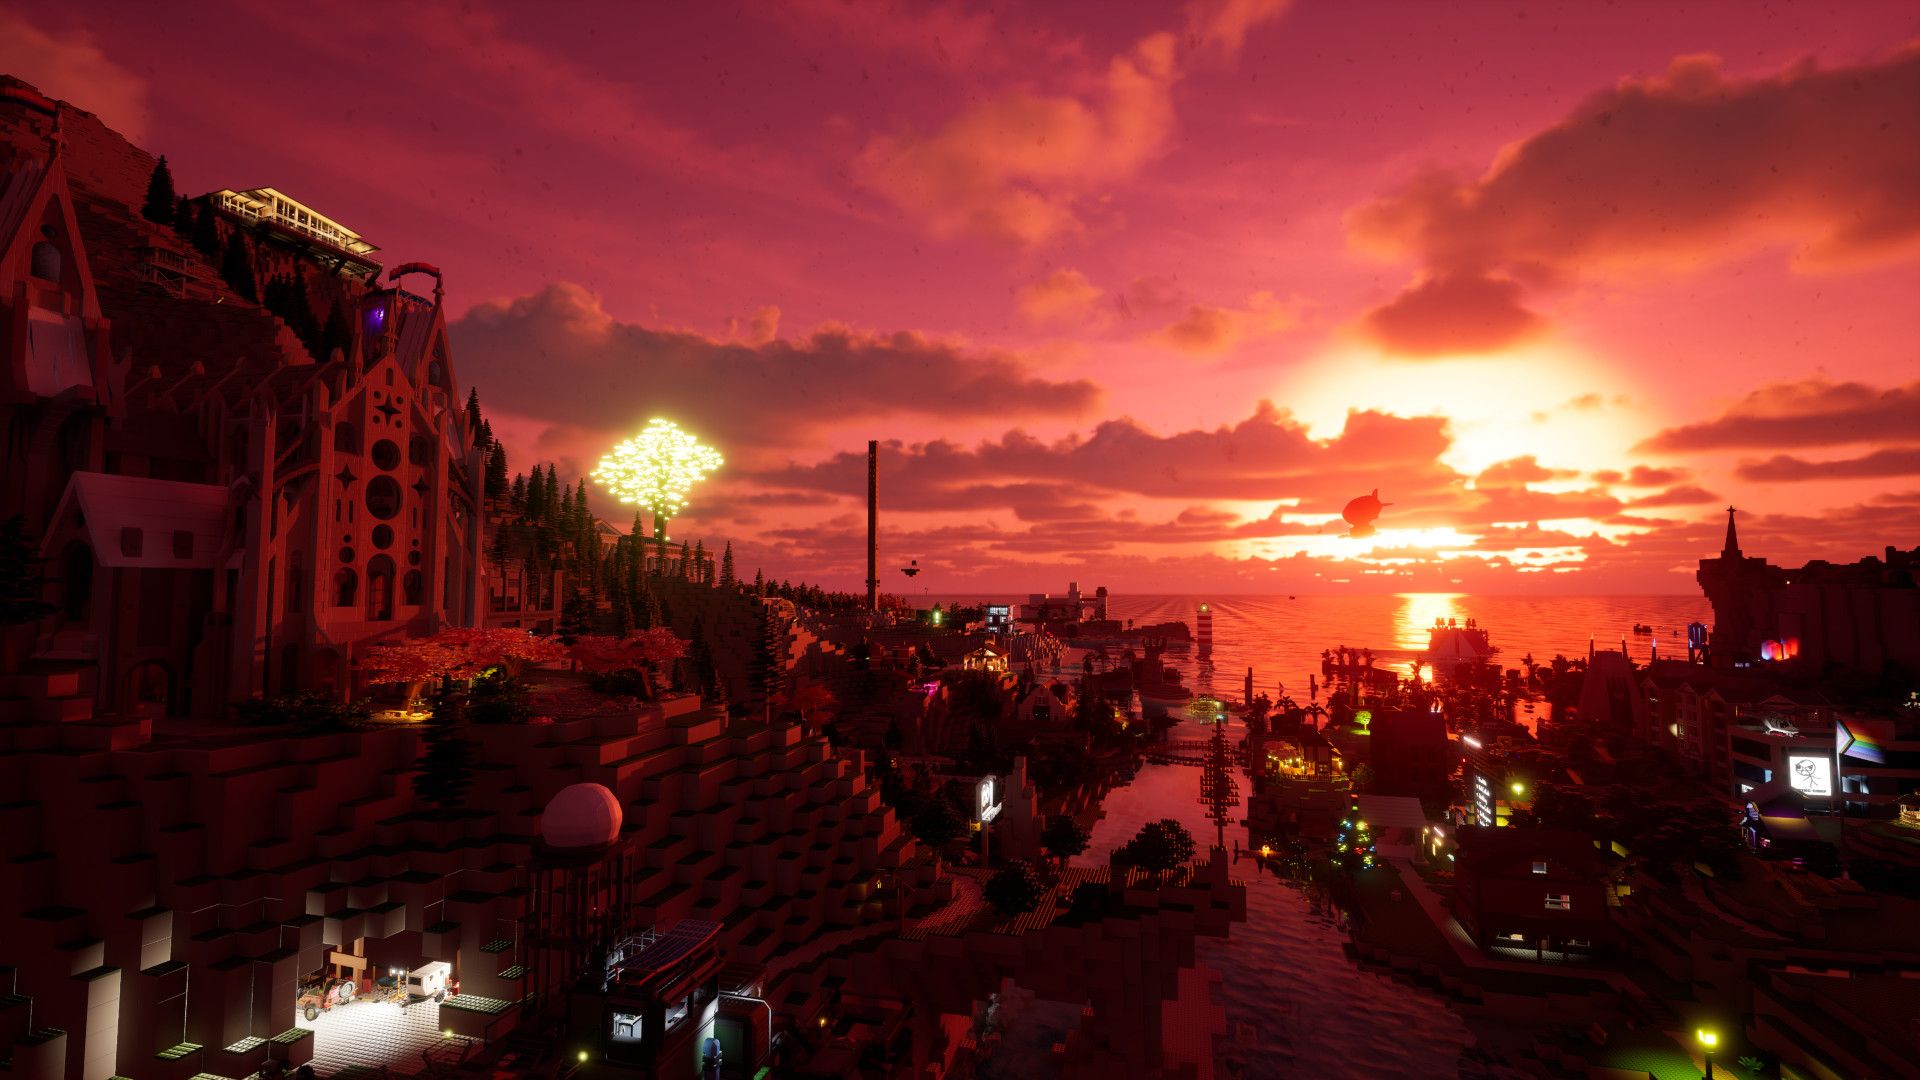
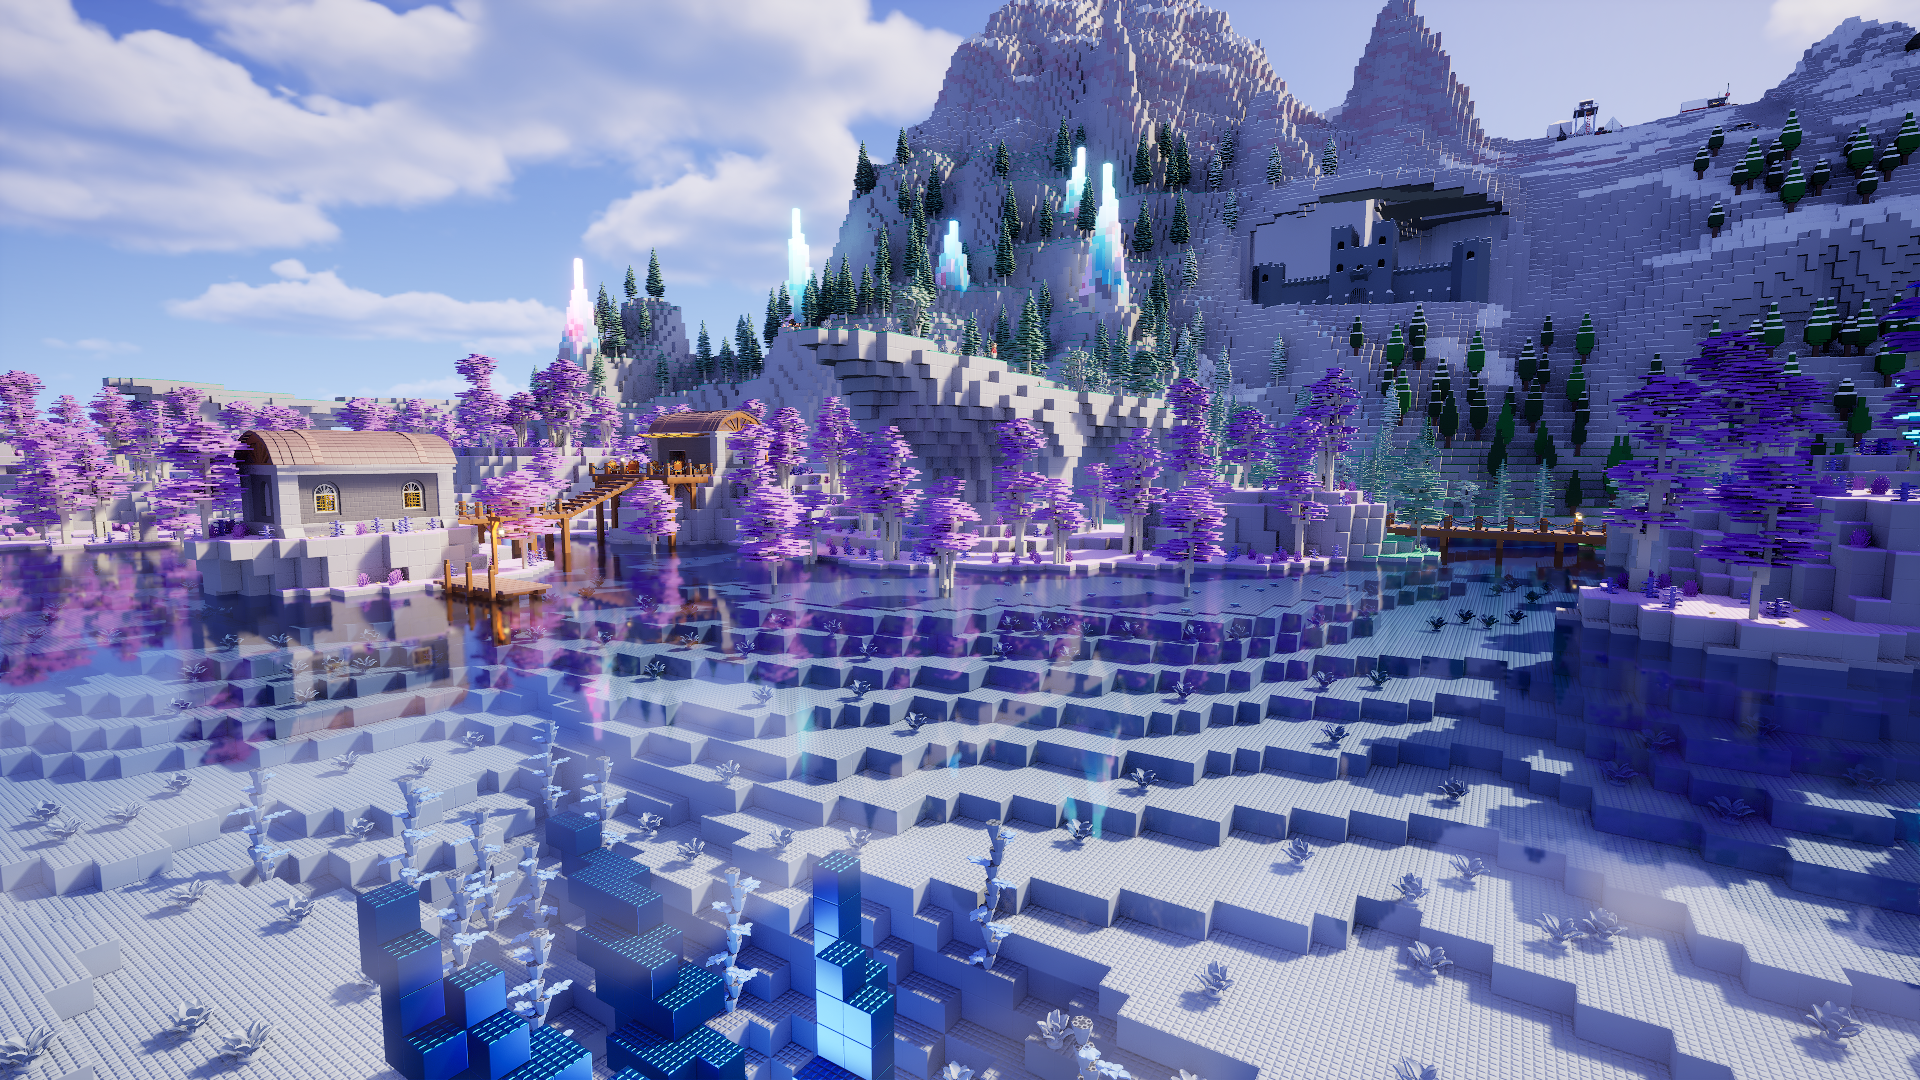
Volumetric Clouds
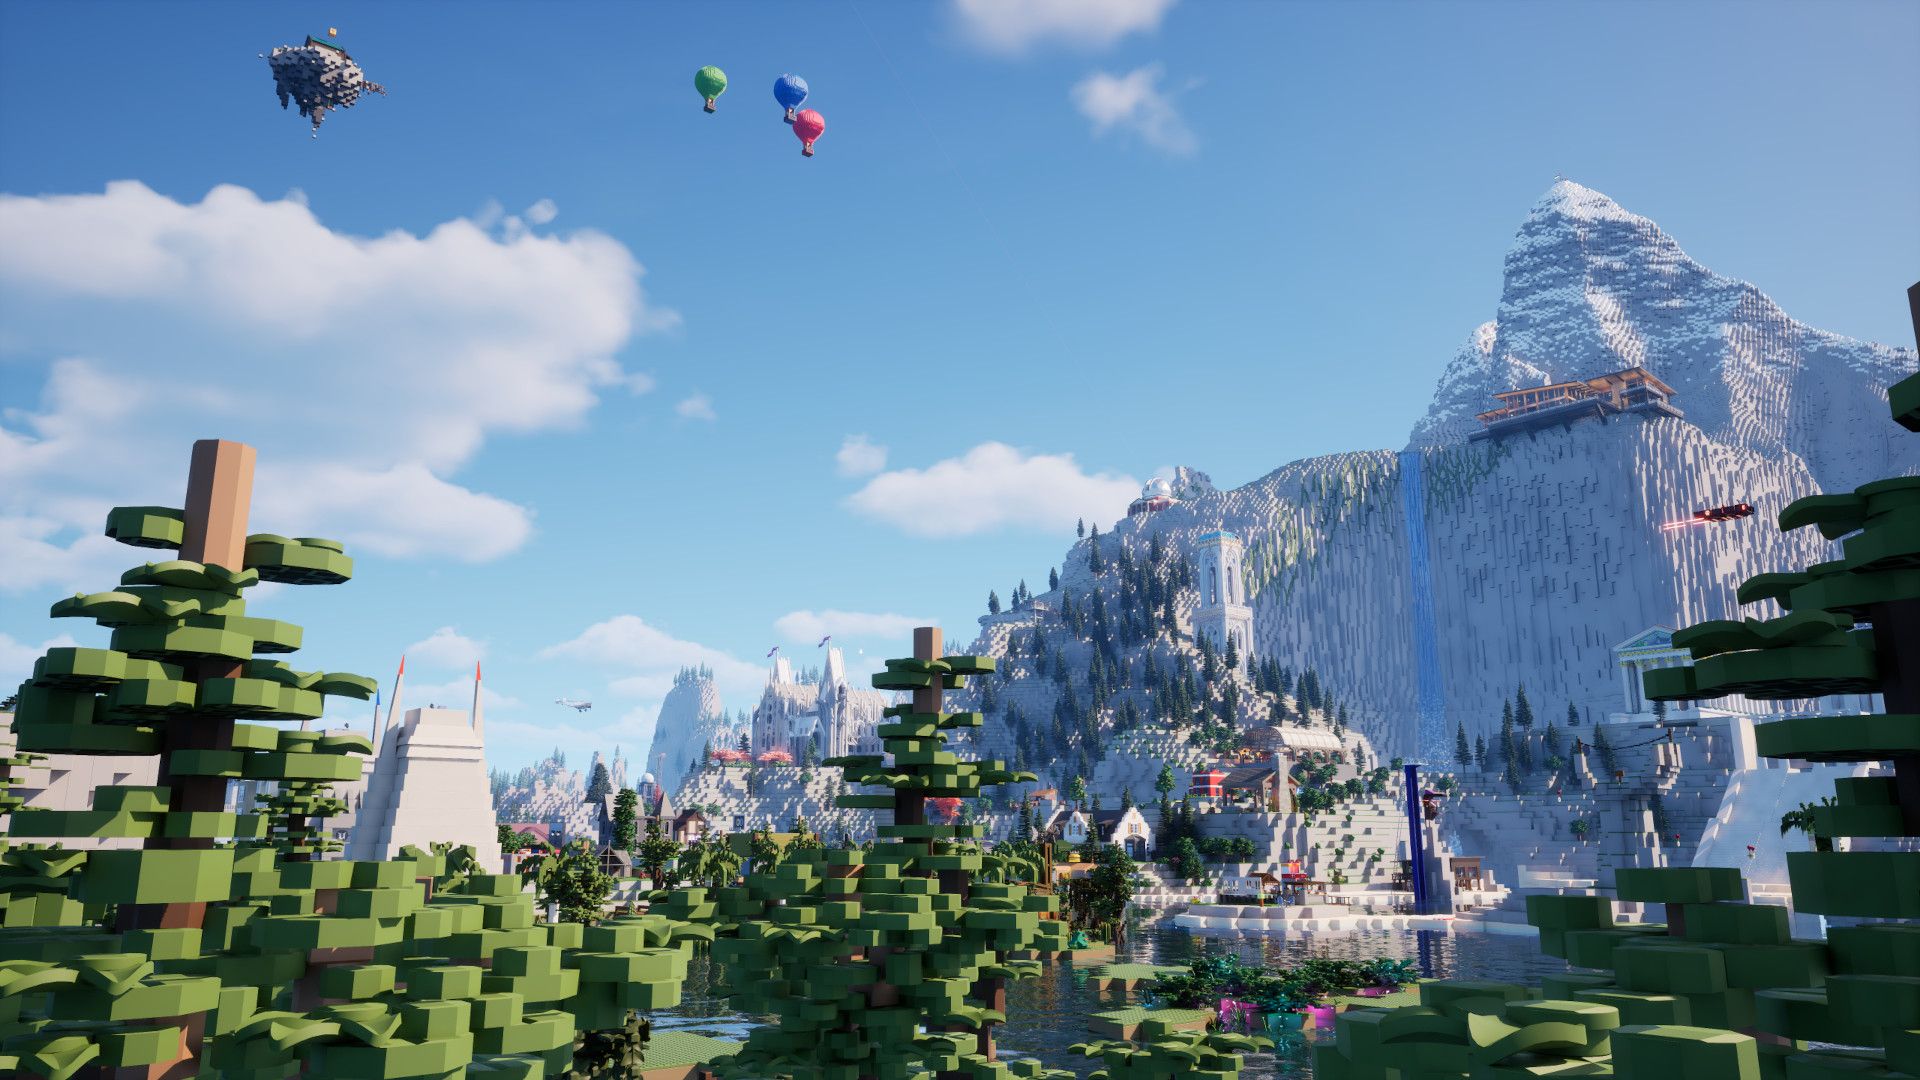
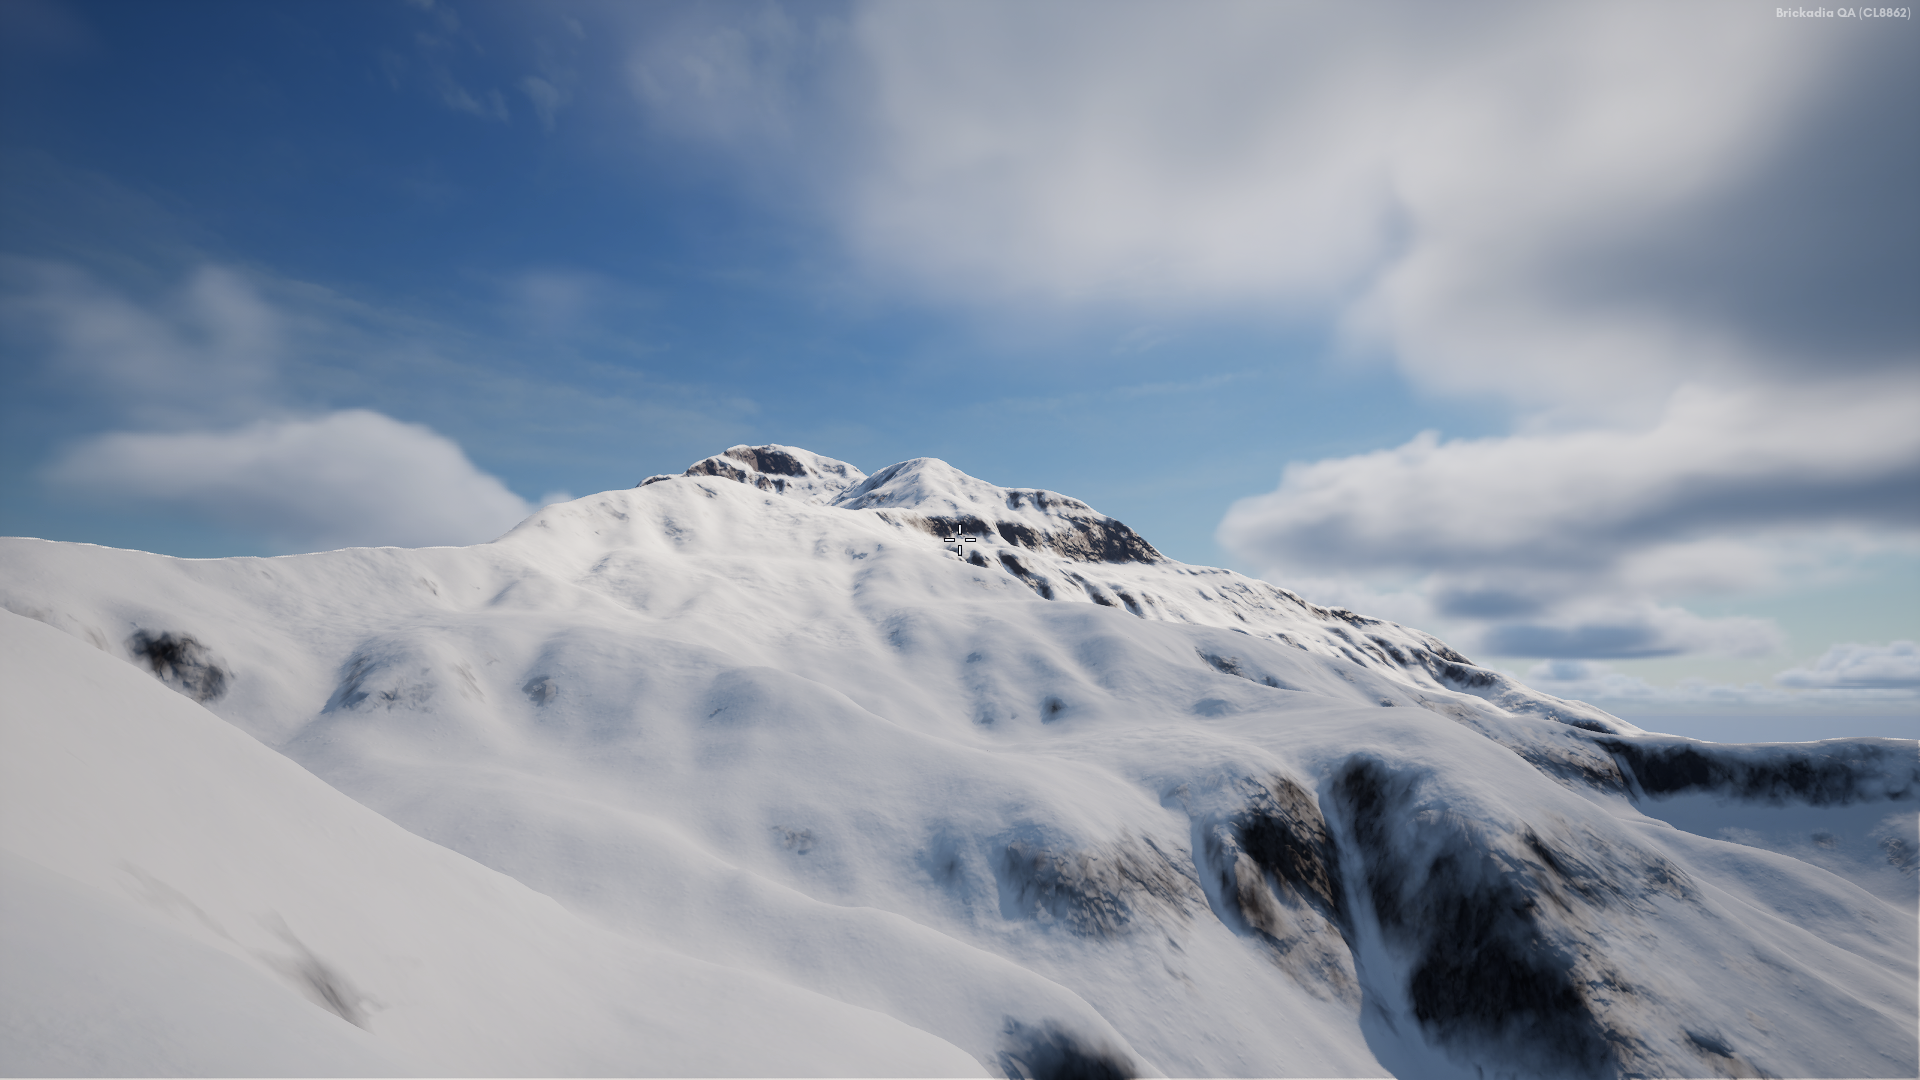
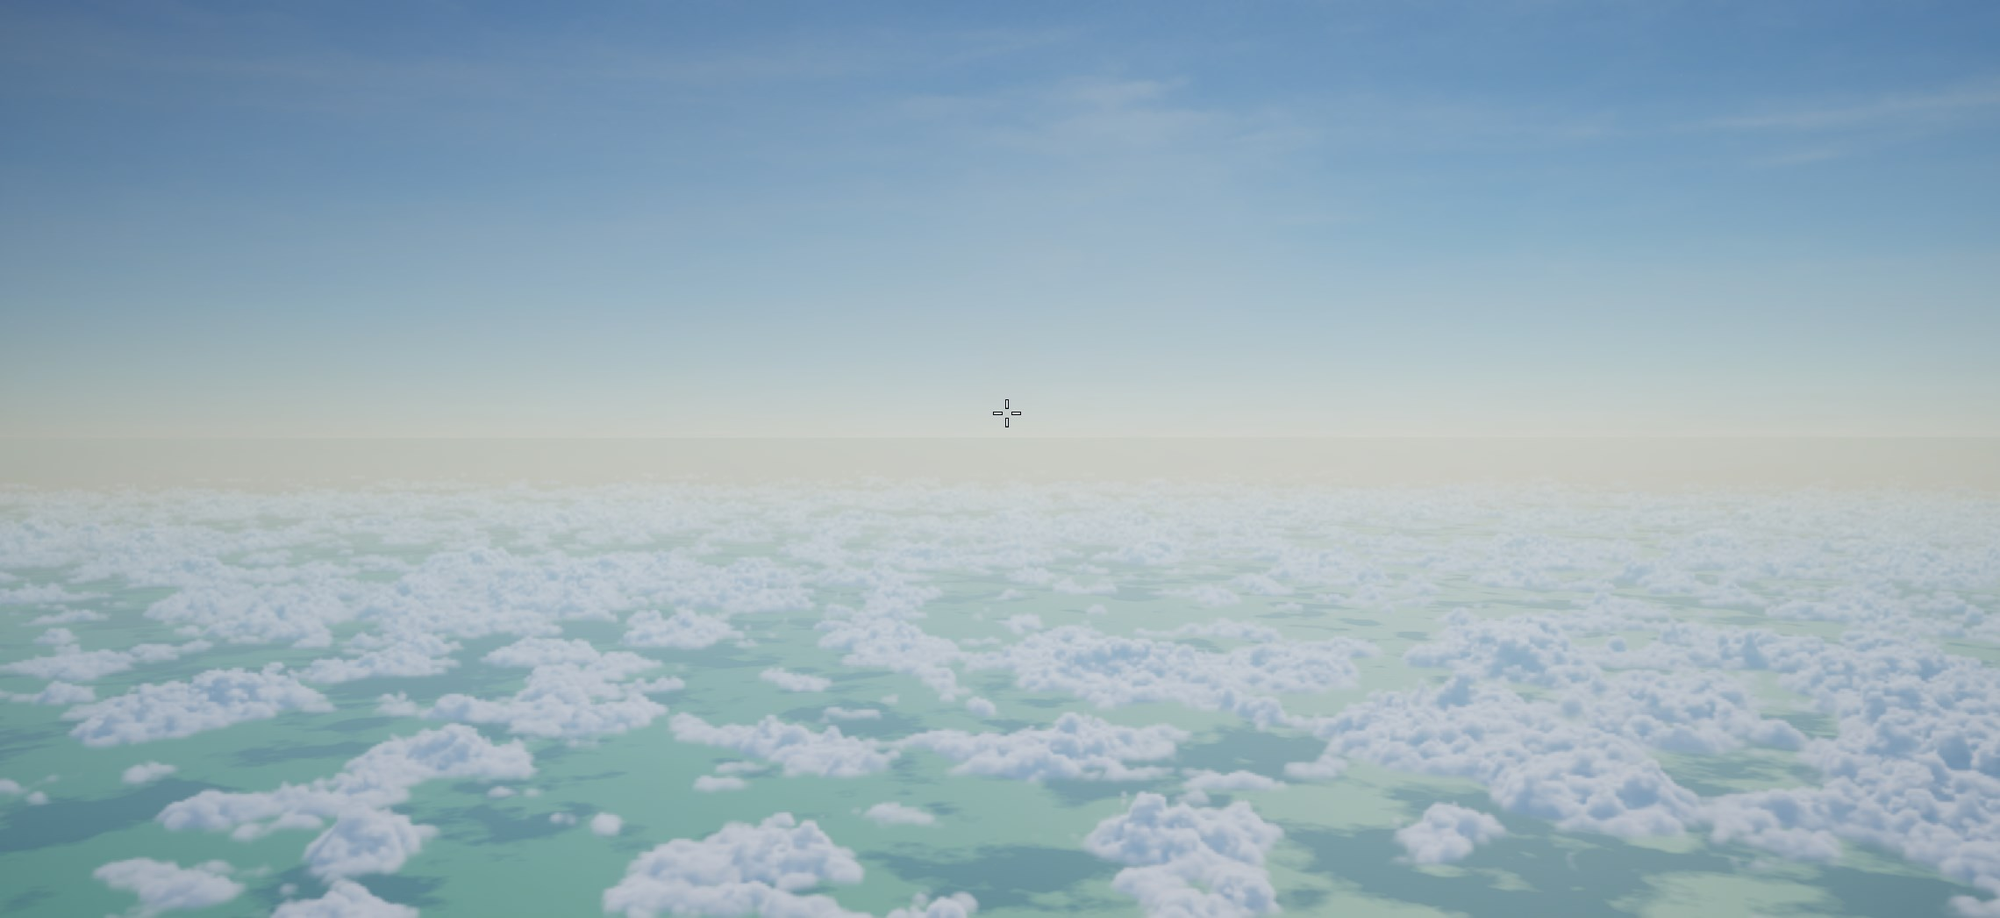
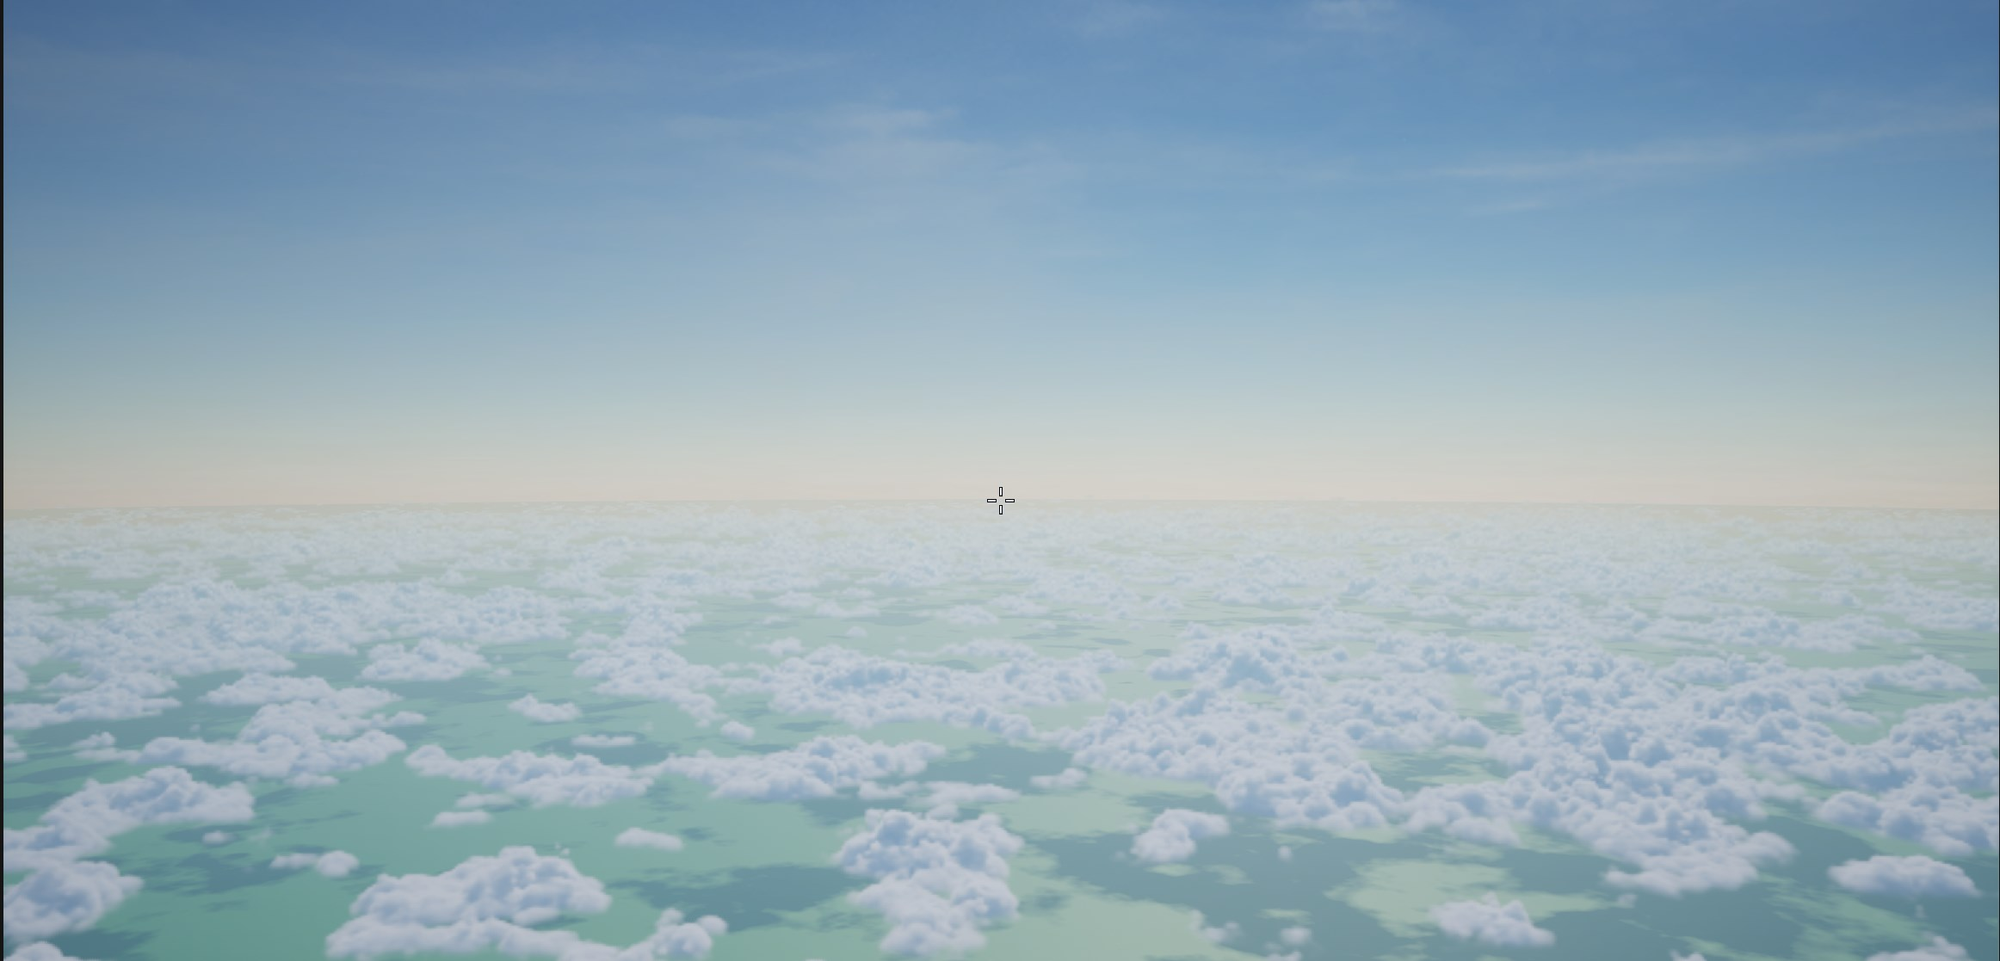
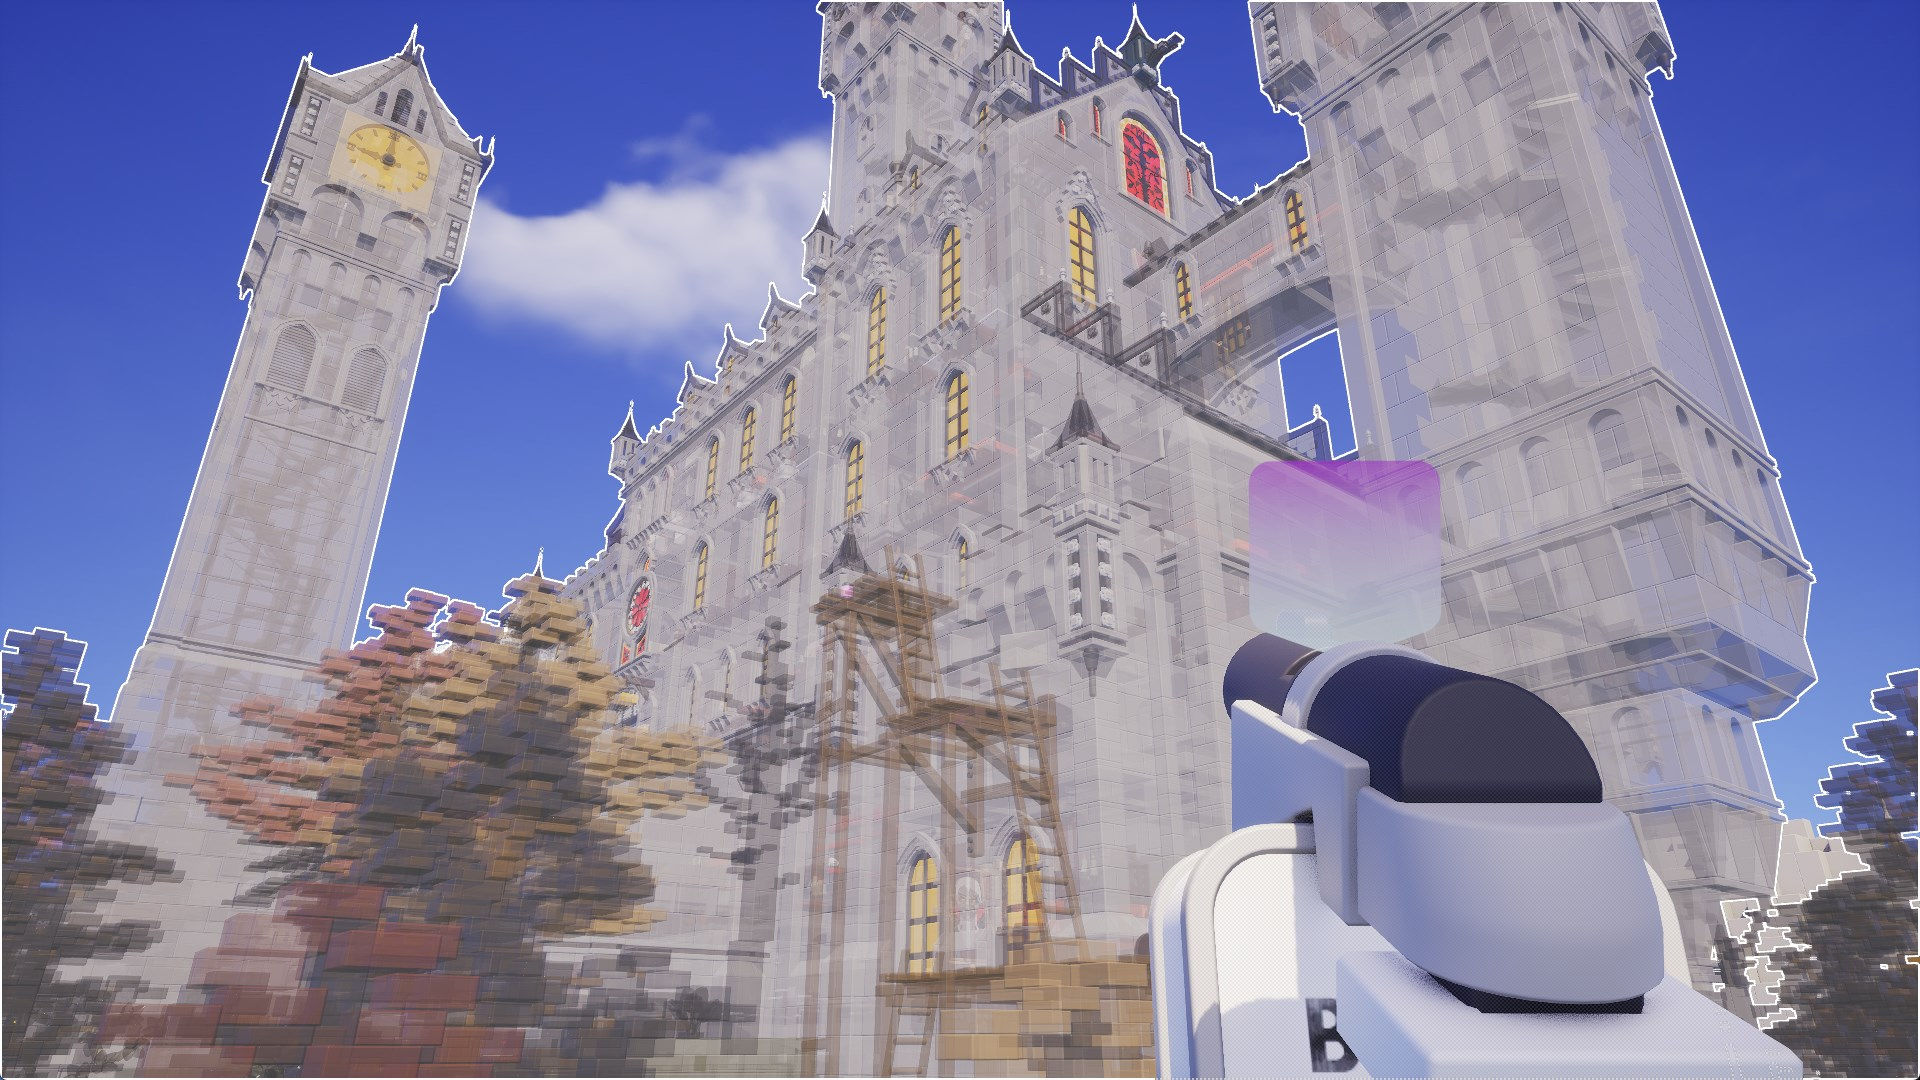
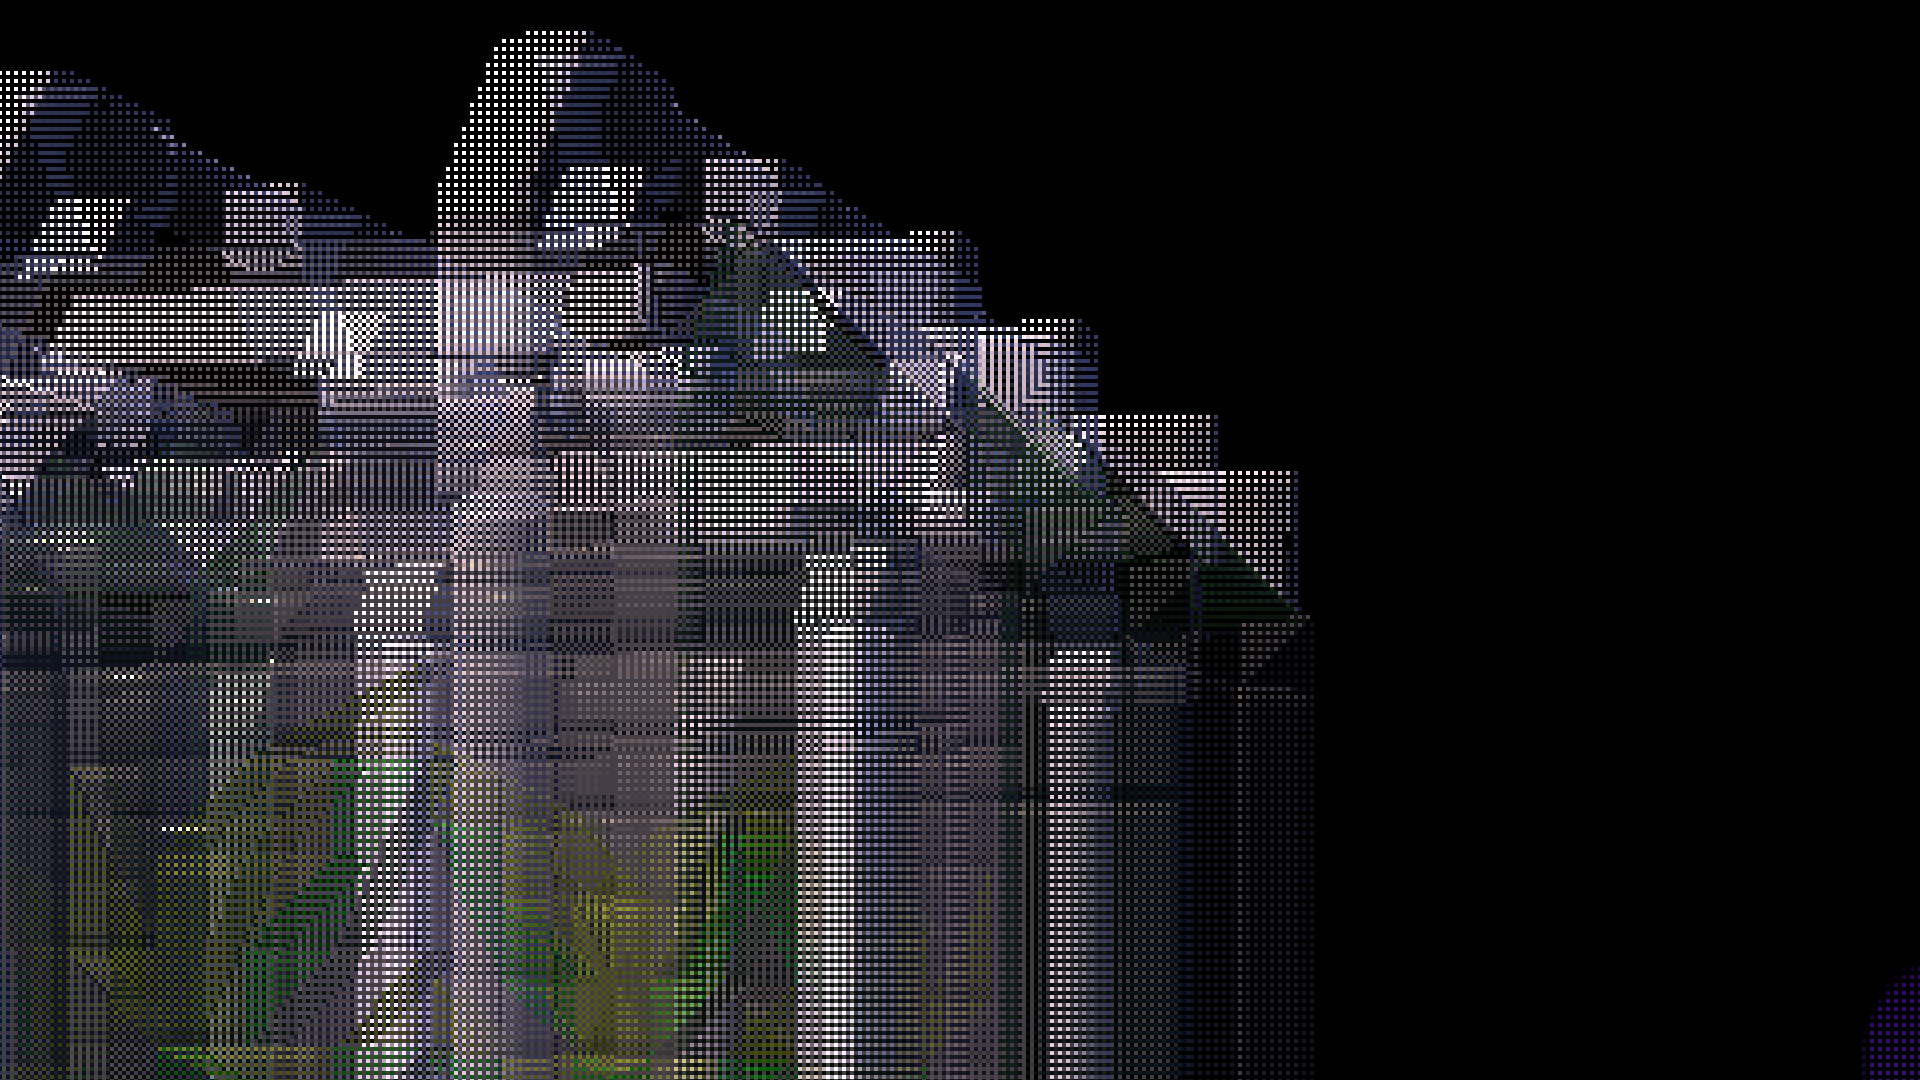
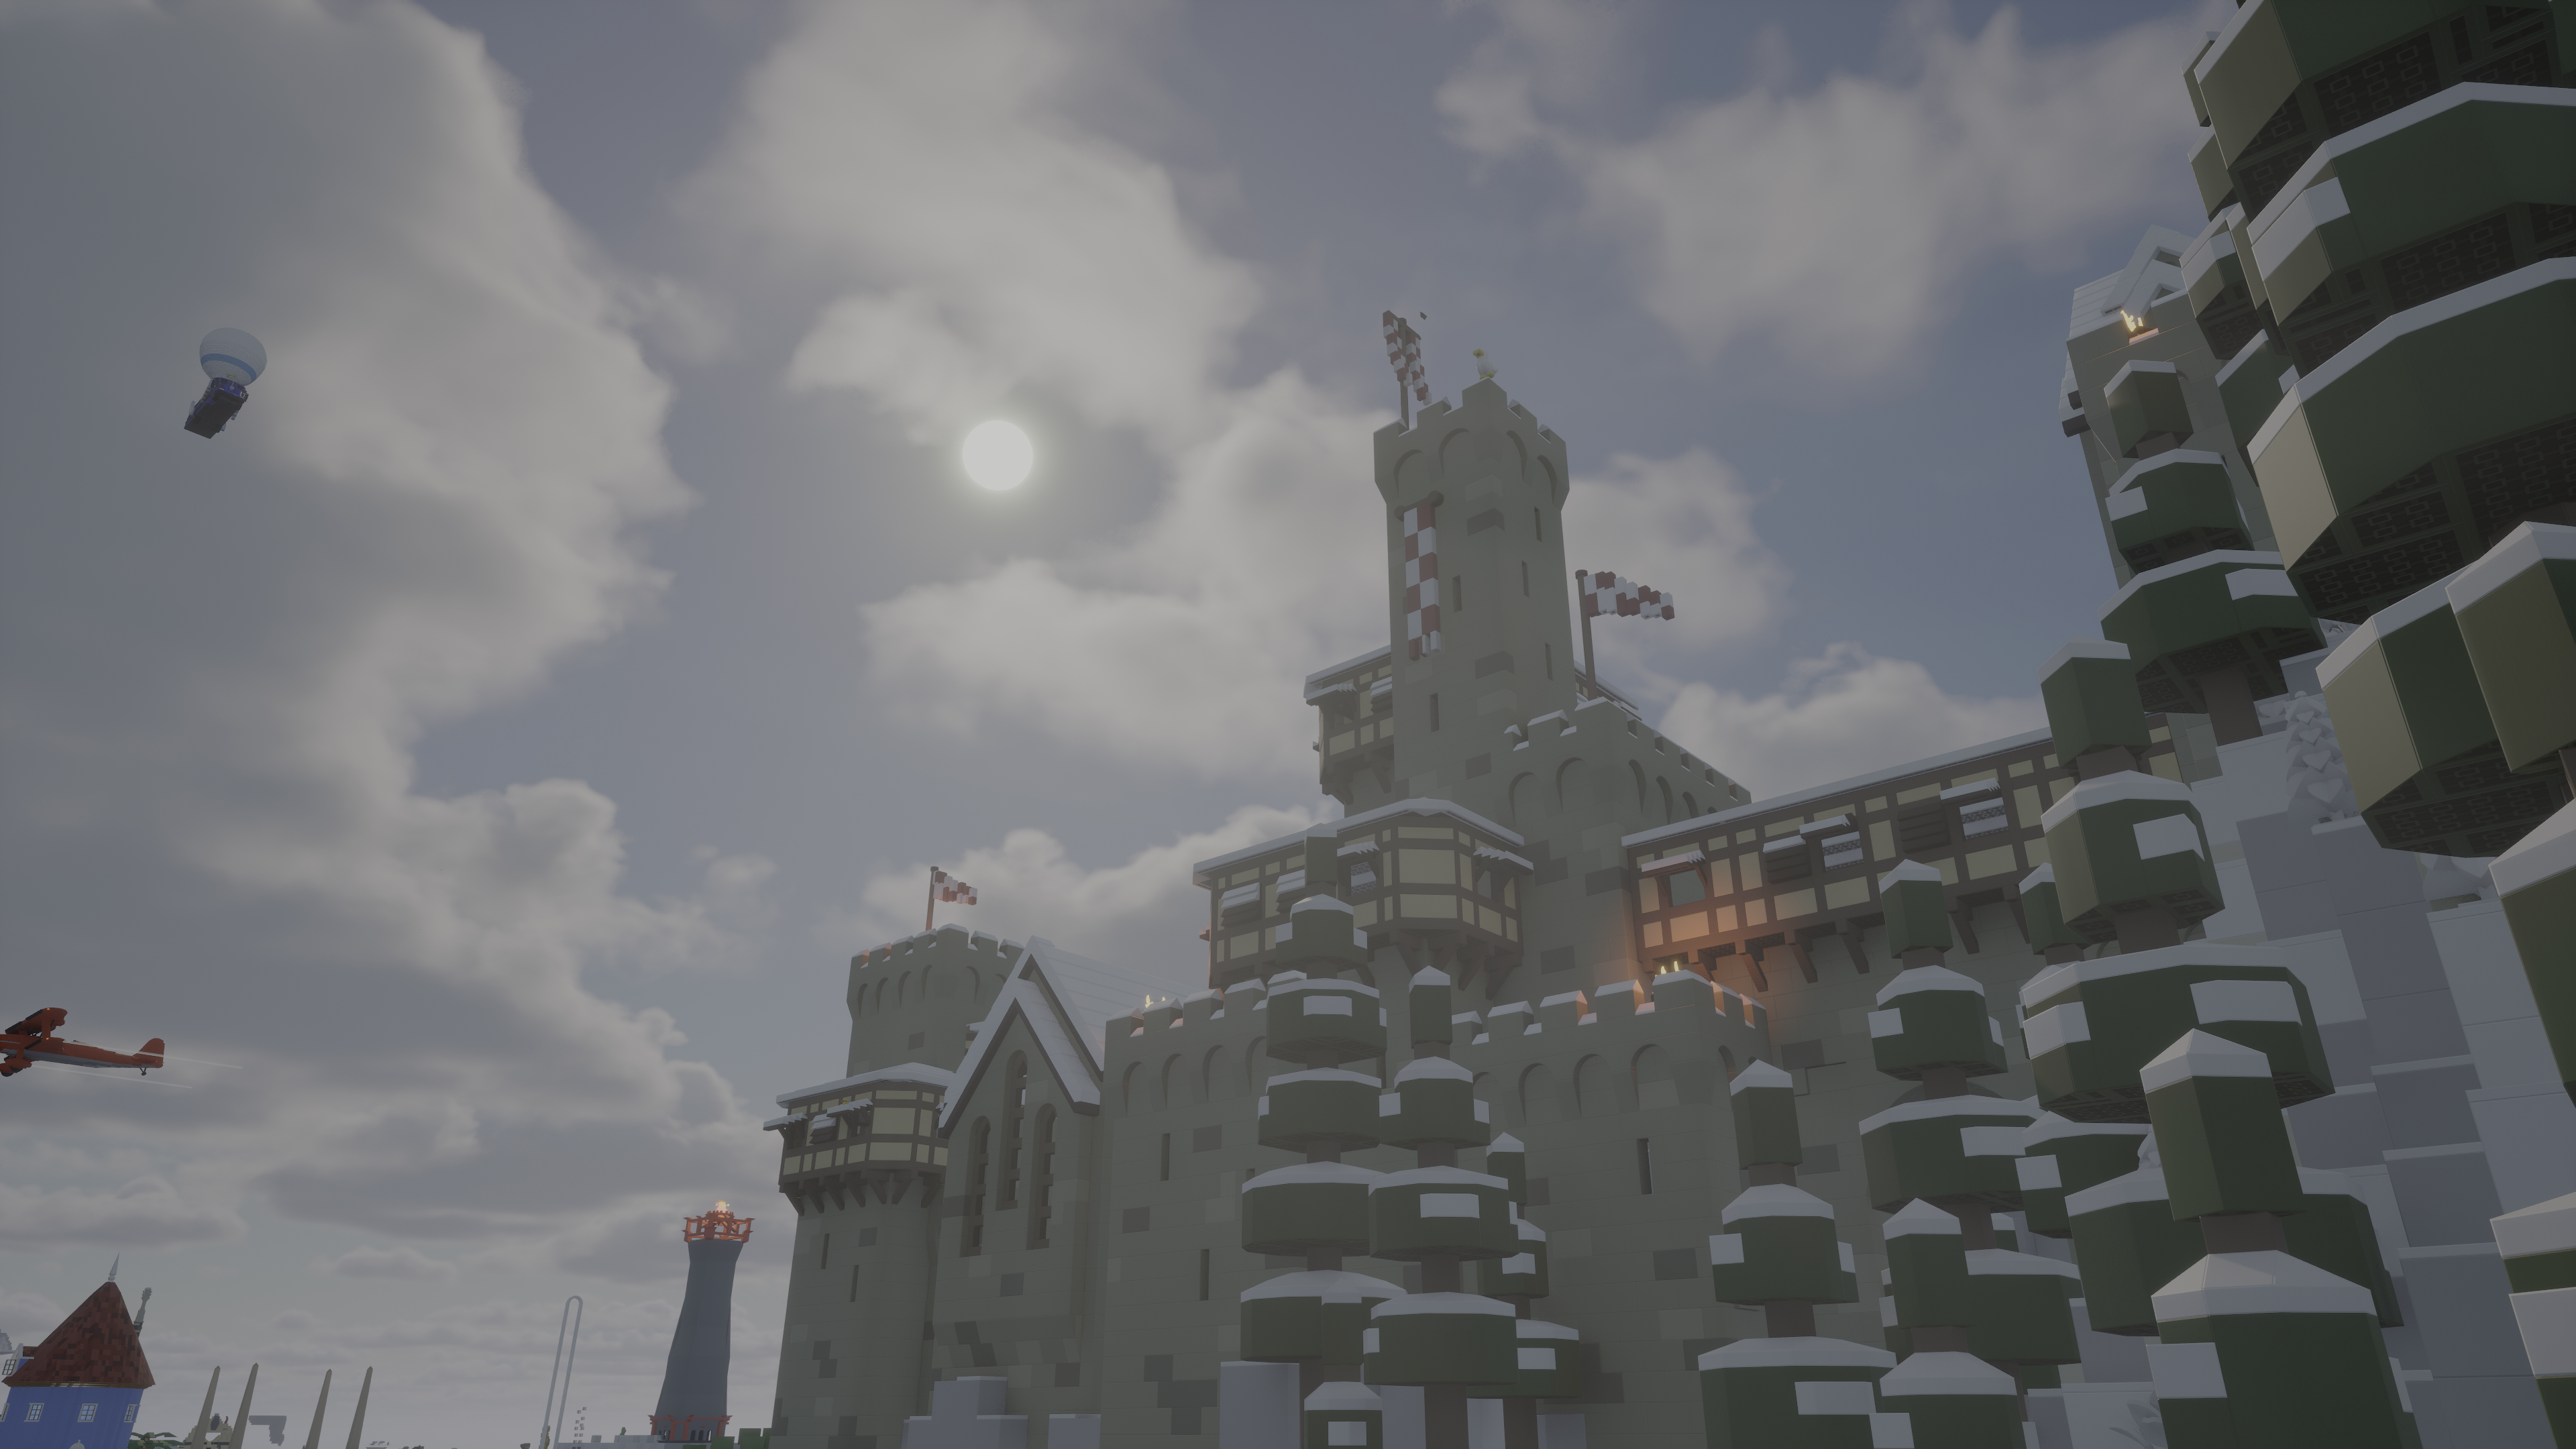
The most striking difference you'll notice are the clouds. Now that we're at Unreal Engine 5.3, Epic has slowly improved the performance of their new volumetric cloud system so much that we can actually consider using it in game. Just look at how pretty the clouds are!
Woops, wrong image. Let's try that again:
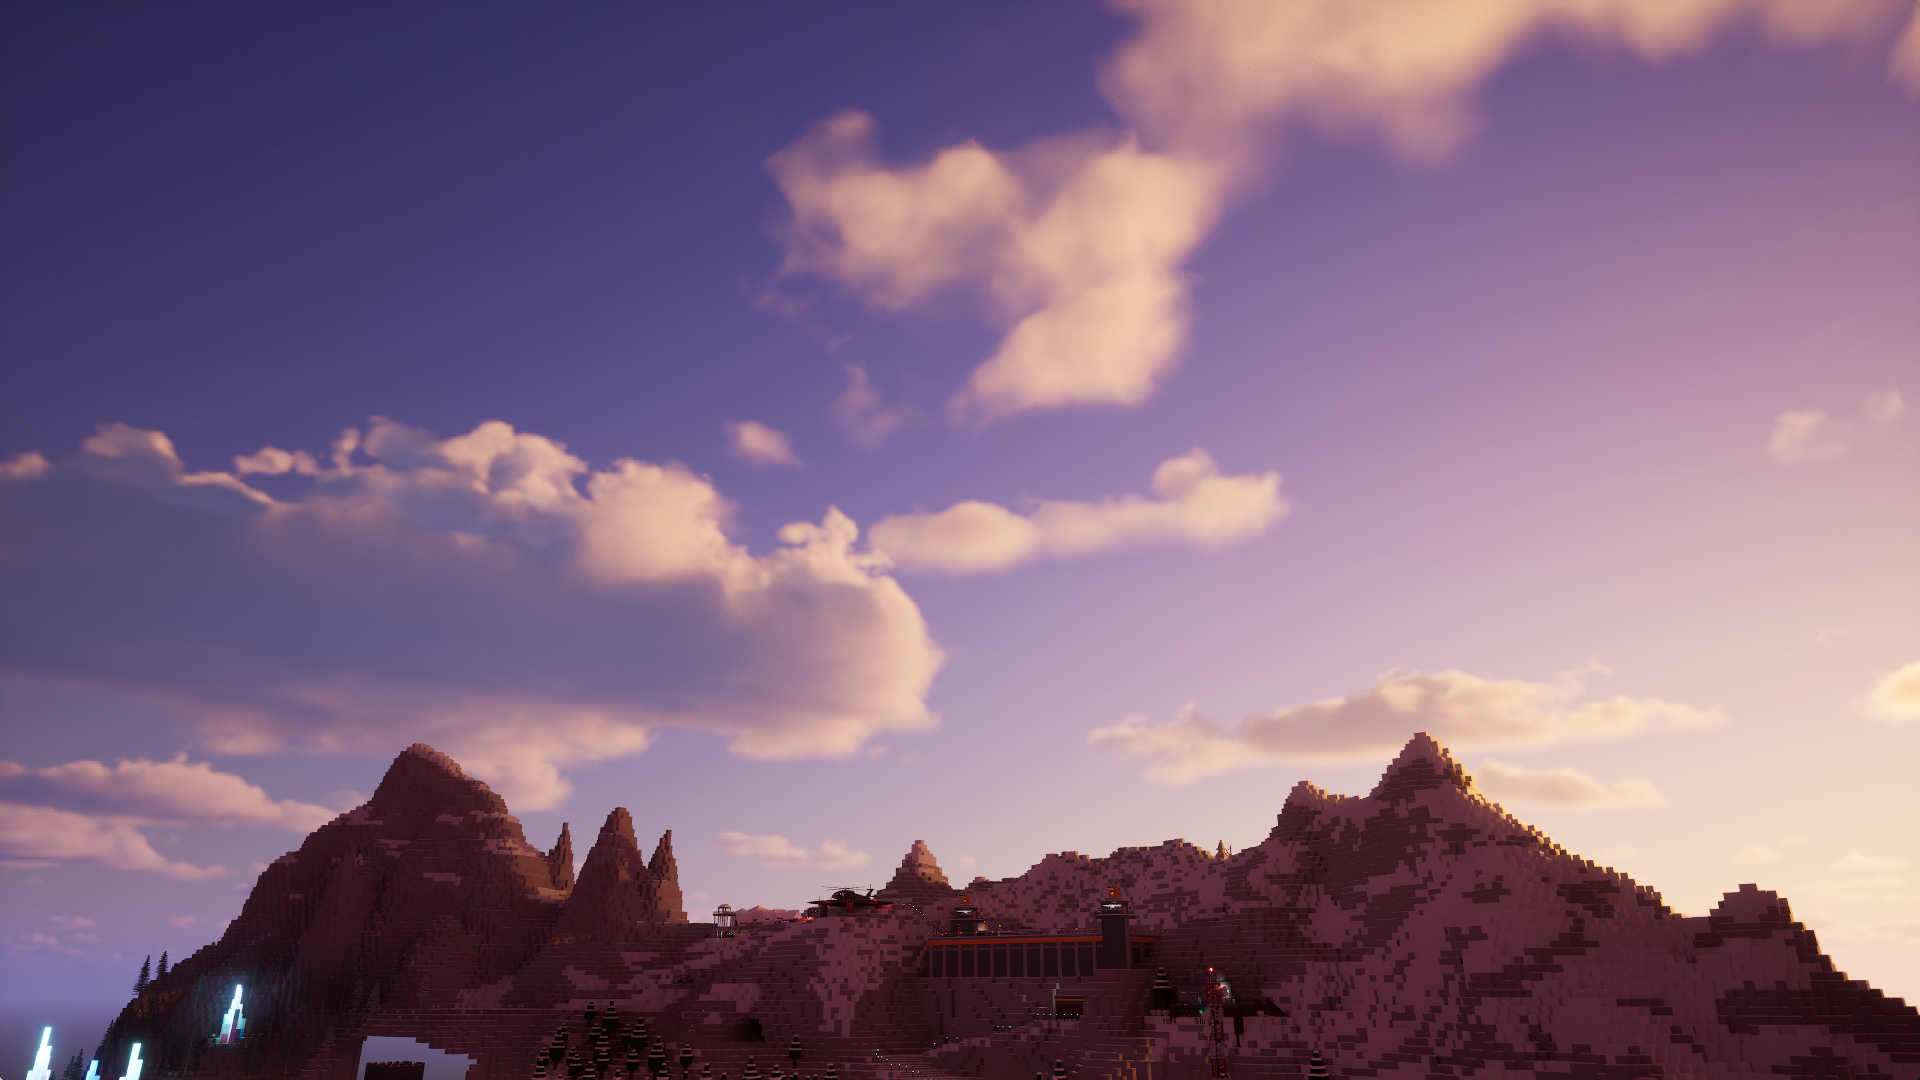
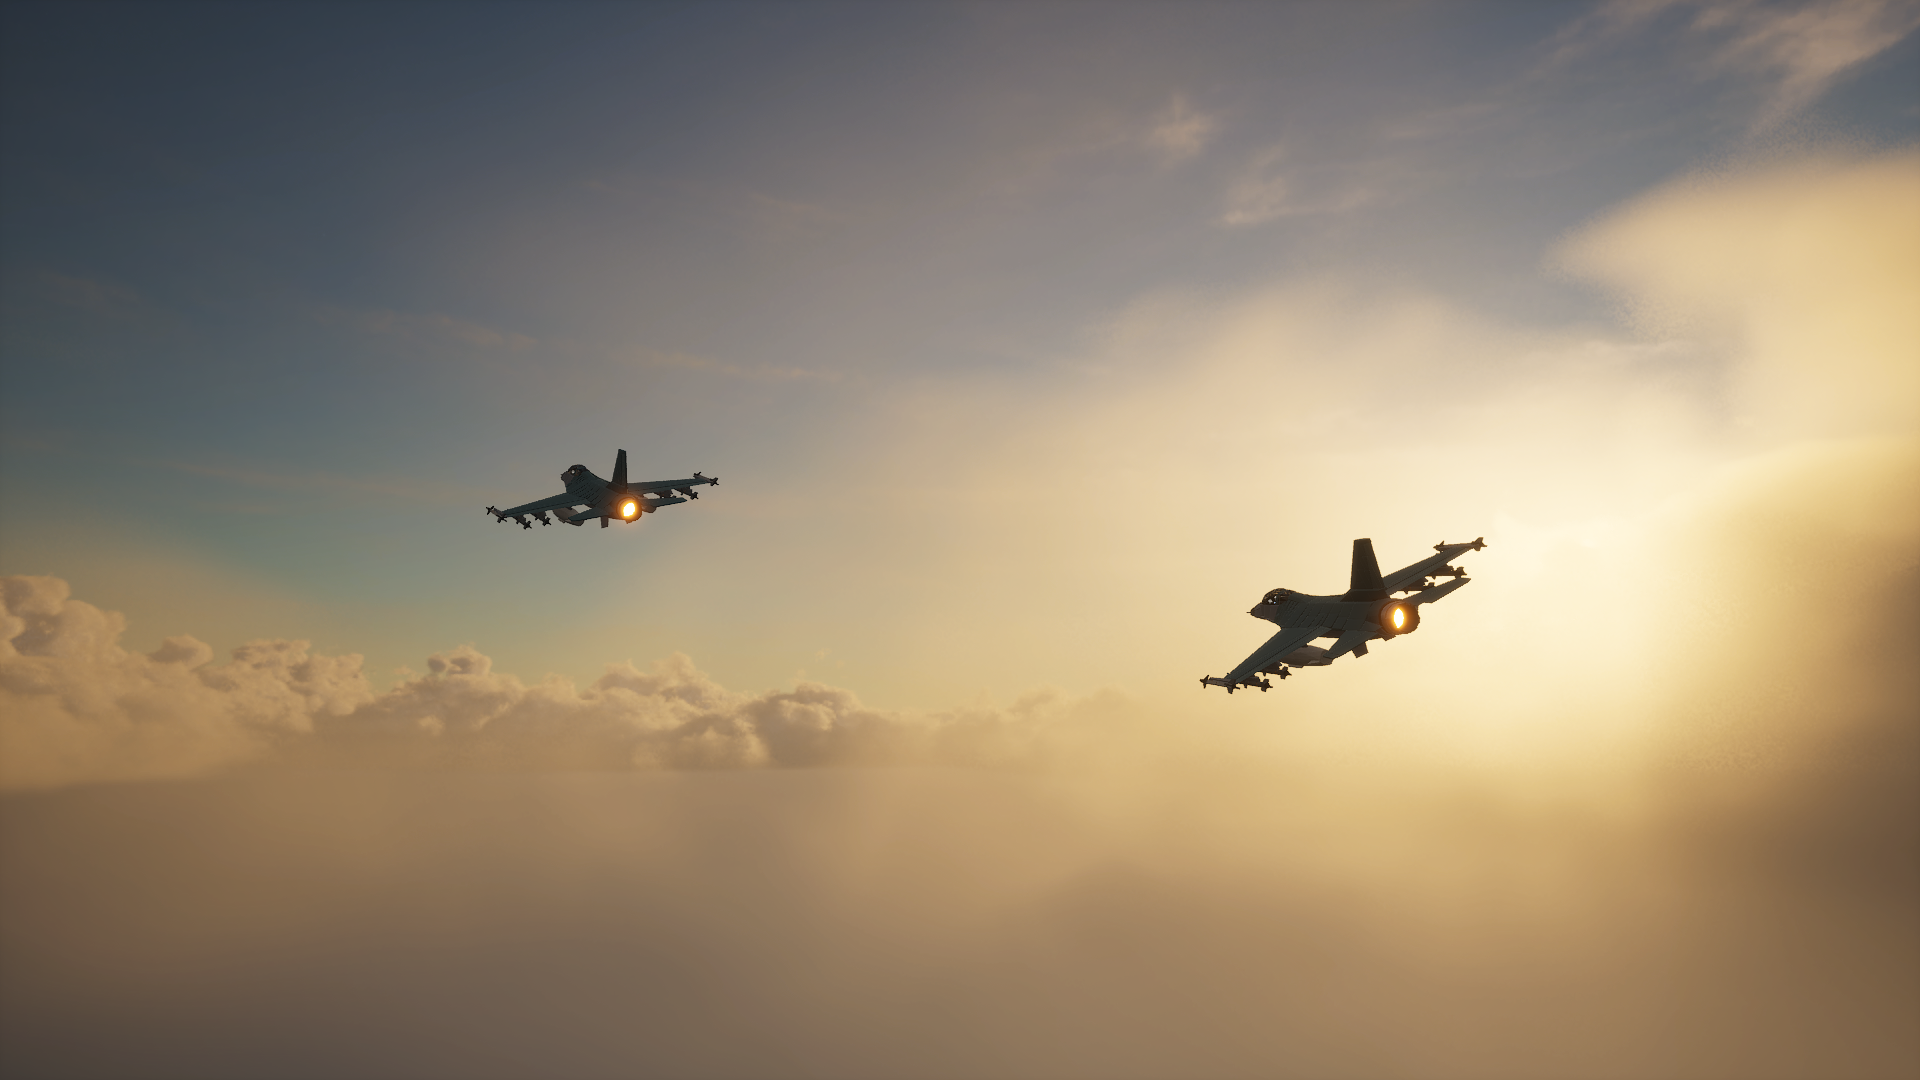
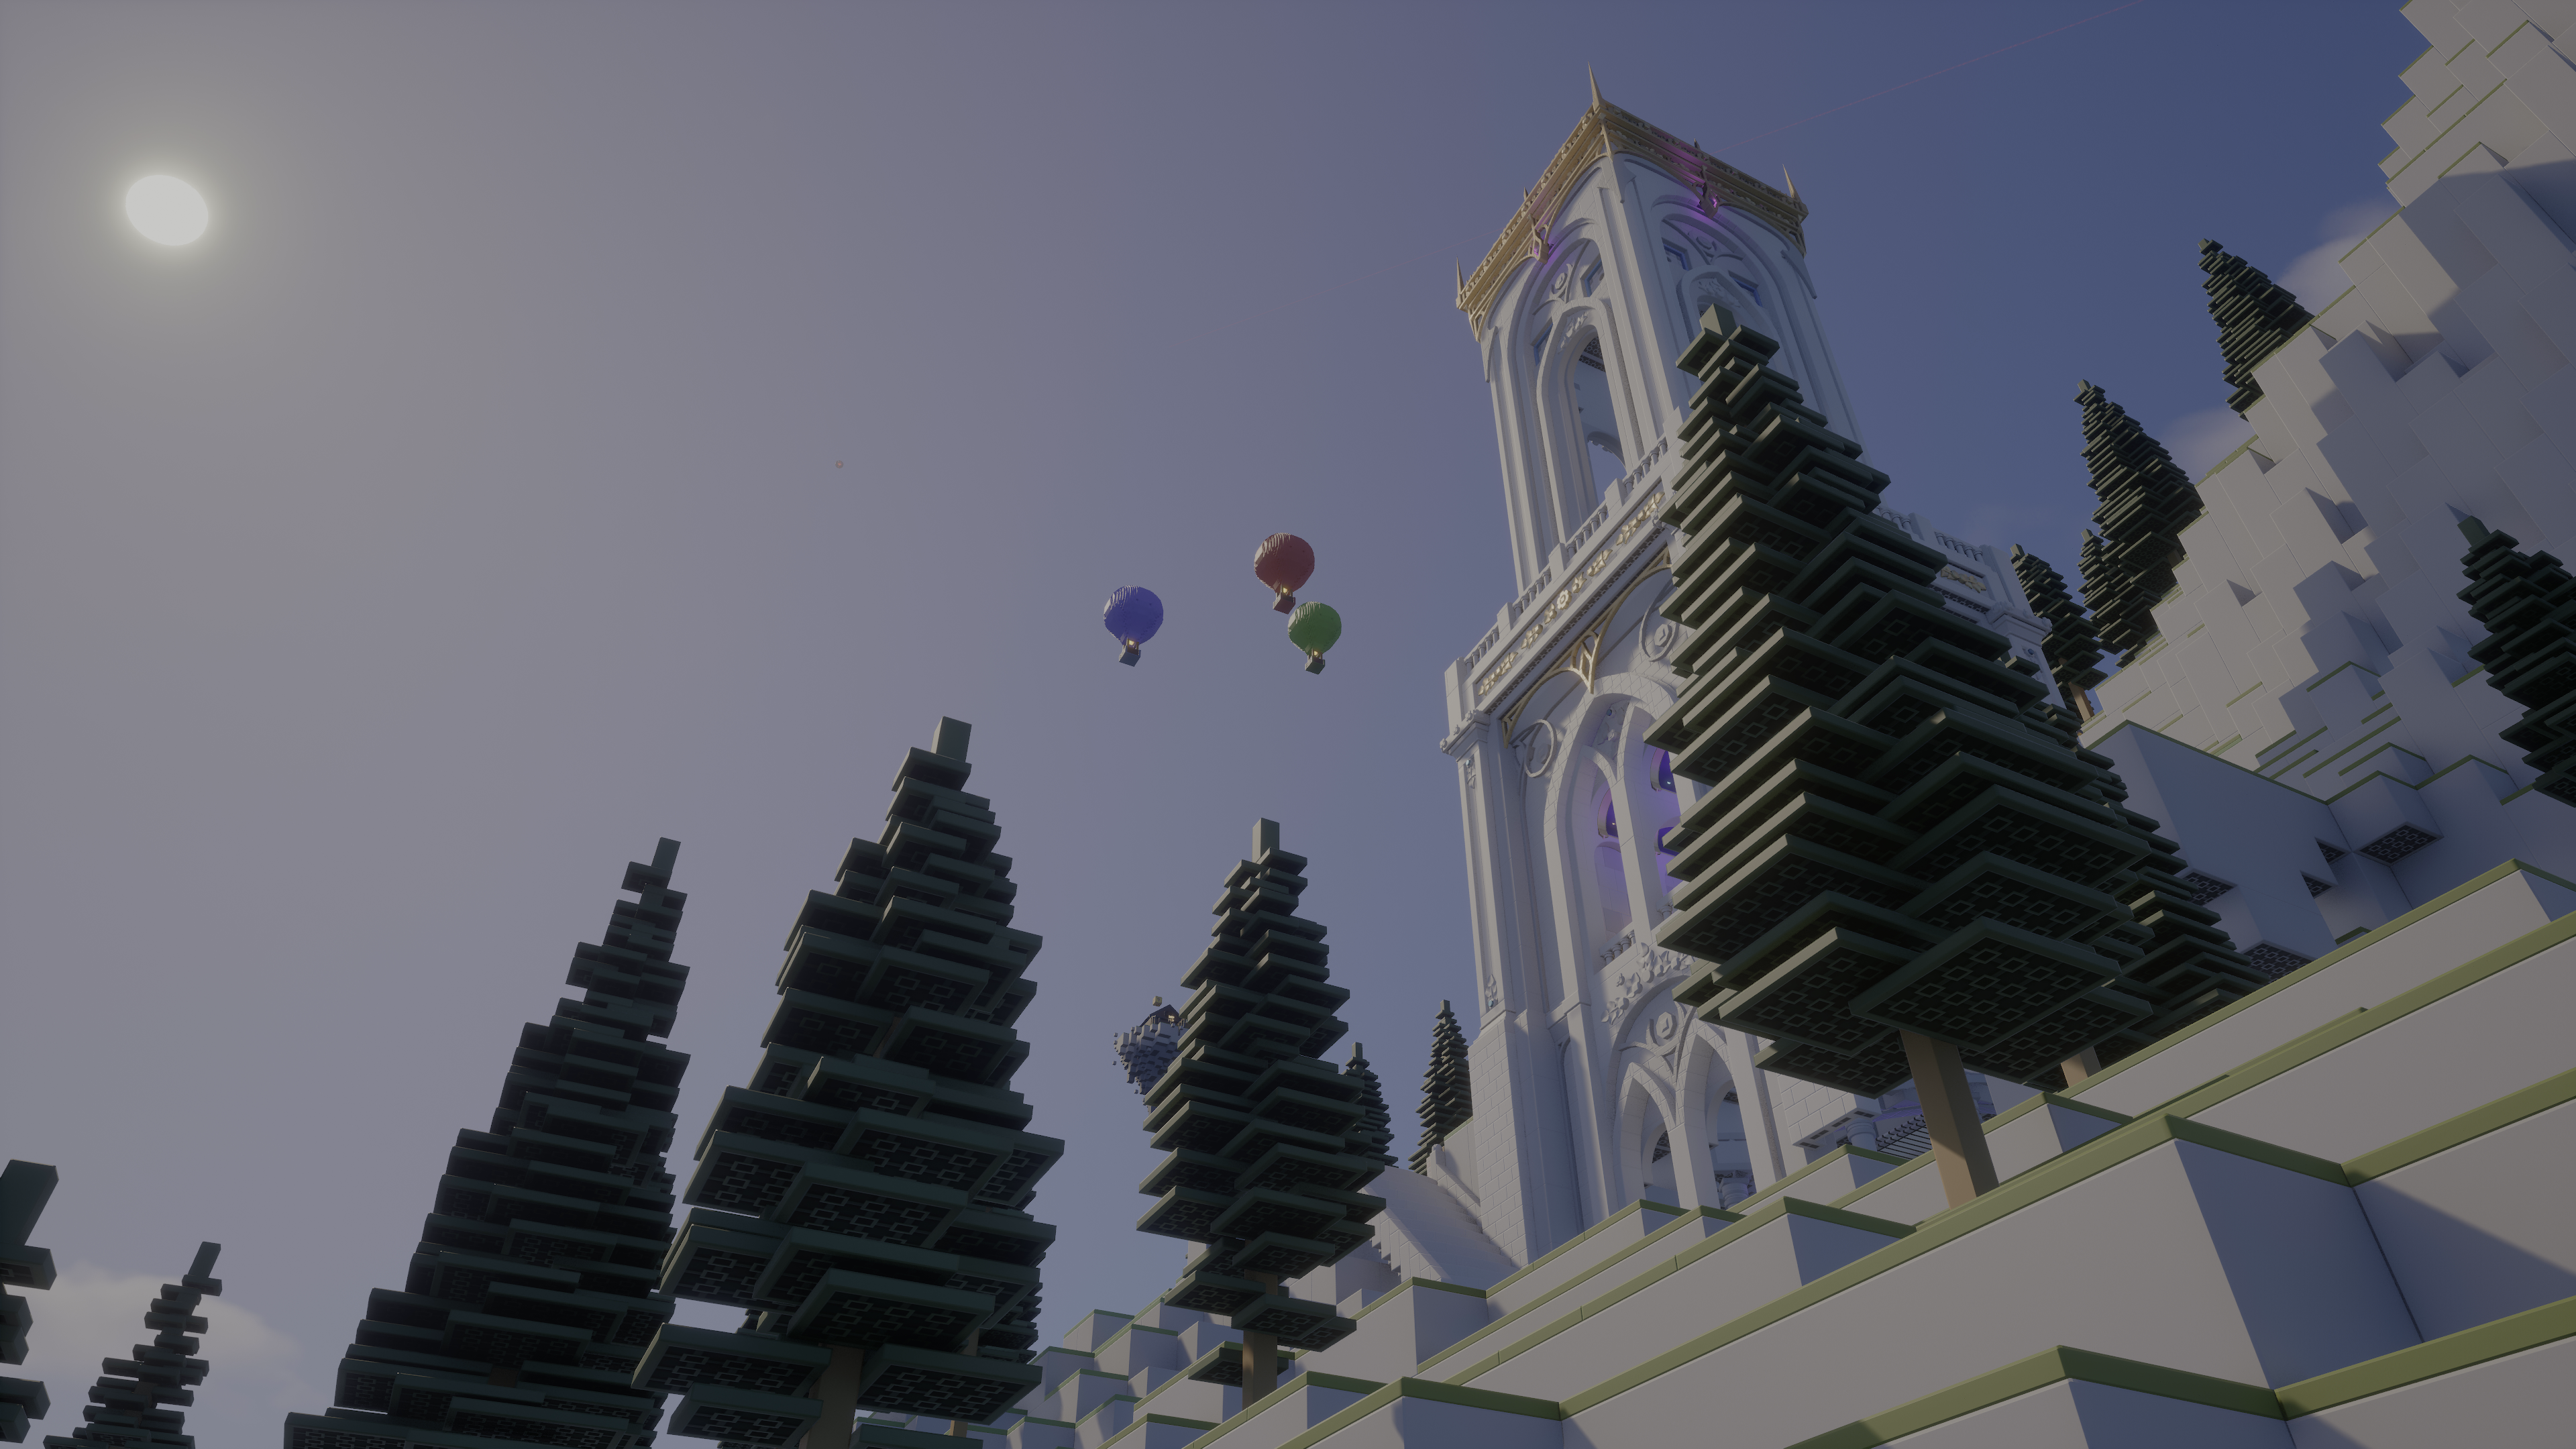
But wait, there's more. Volumetric clouds are actually located at a fixed height in the world, so you can fly towards them, and then above...
Yes, you can fly vehicles above the clouds, and build things there too.
Now, when I said earlier that they perform well, that doesn't mean the fancy clouds are free. Enabling them, as nice as it looks, will slow down your game a bit. So I've hooked up a graphics setting to turn them back off and essentially revert back to the 2D clouds you've seen in Alpha 5, ensuring we don't degrade performance on low end hardware as we get closer to the release.
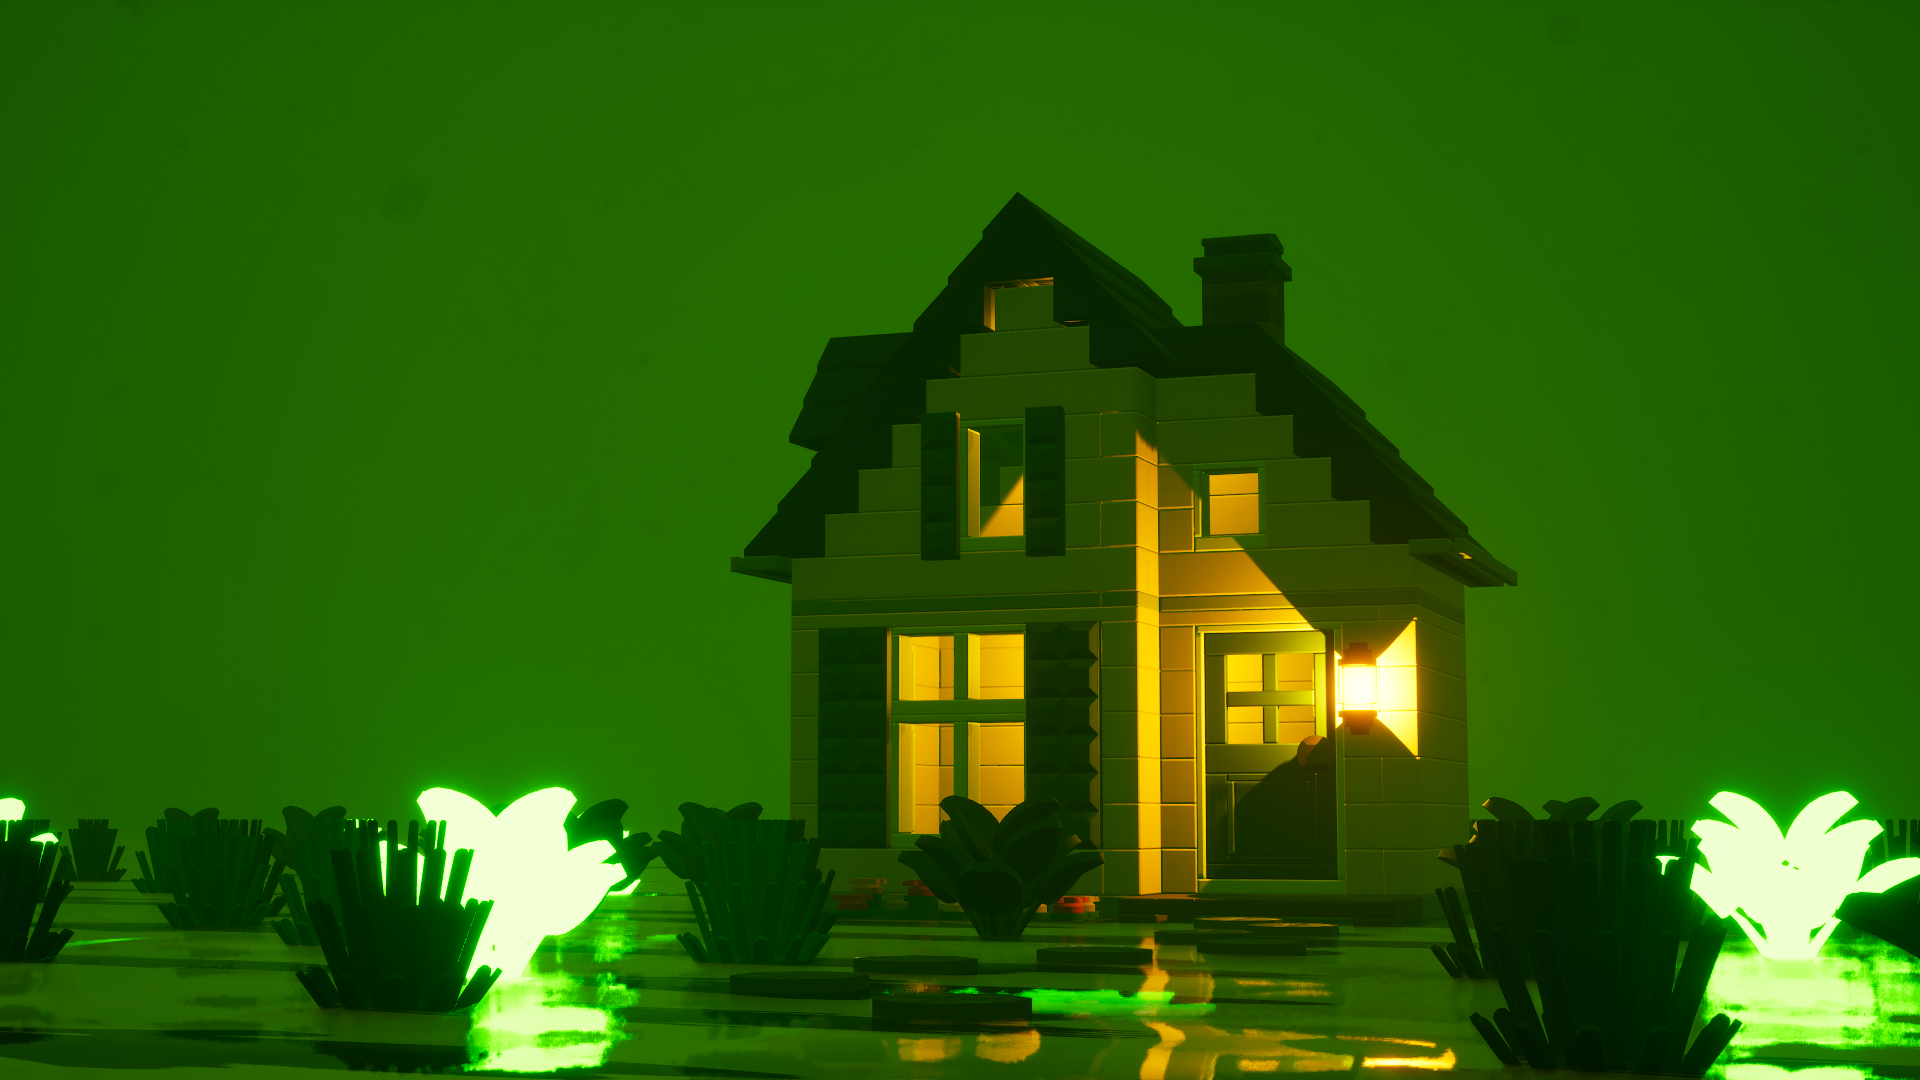
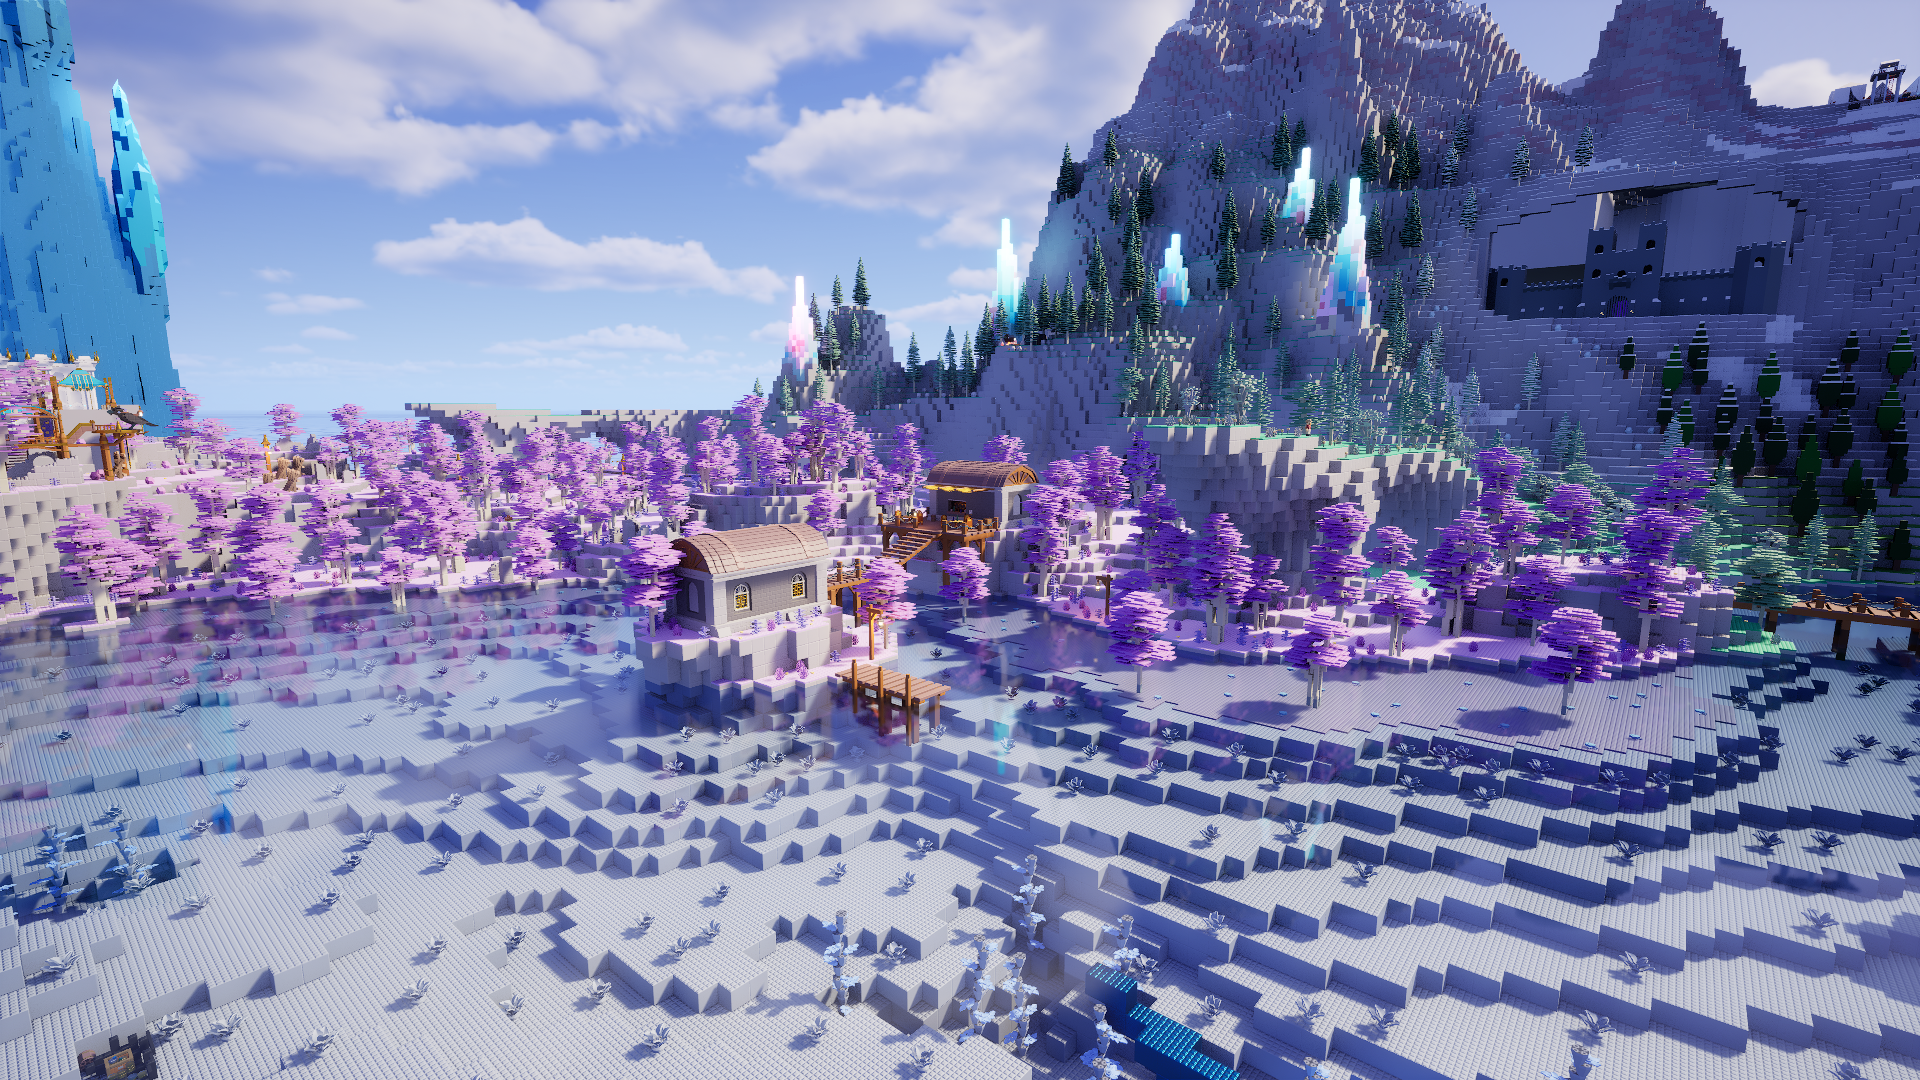
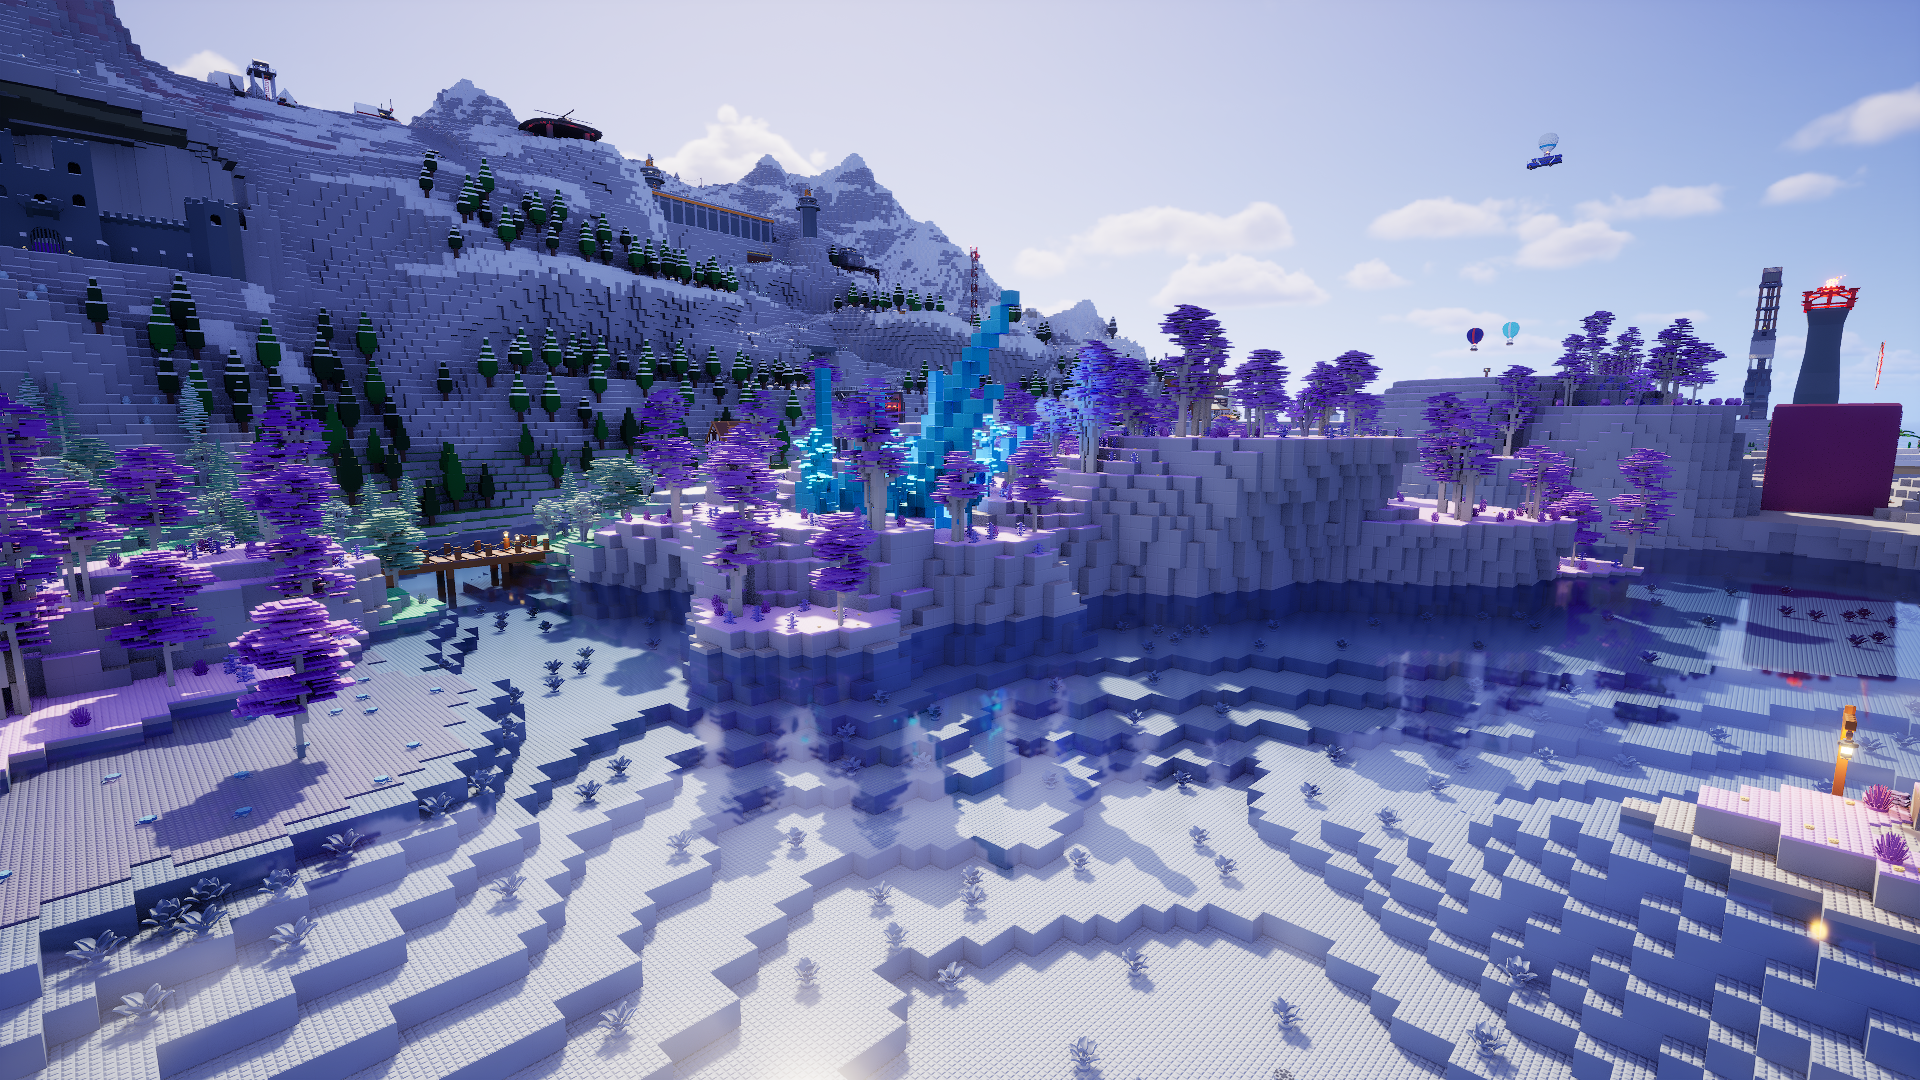
New Environment Settings
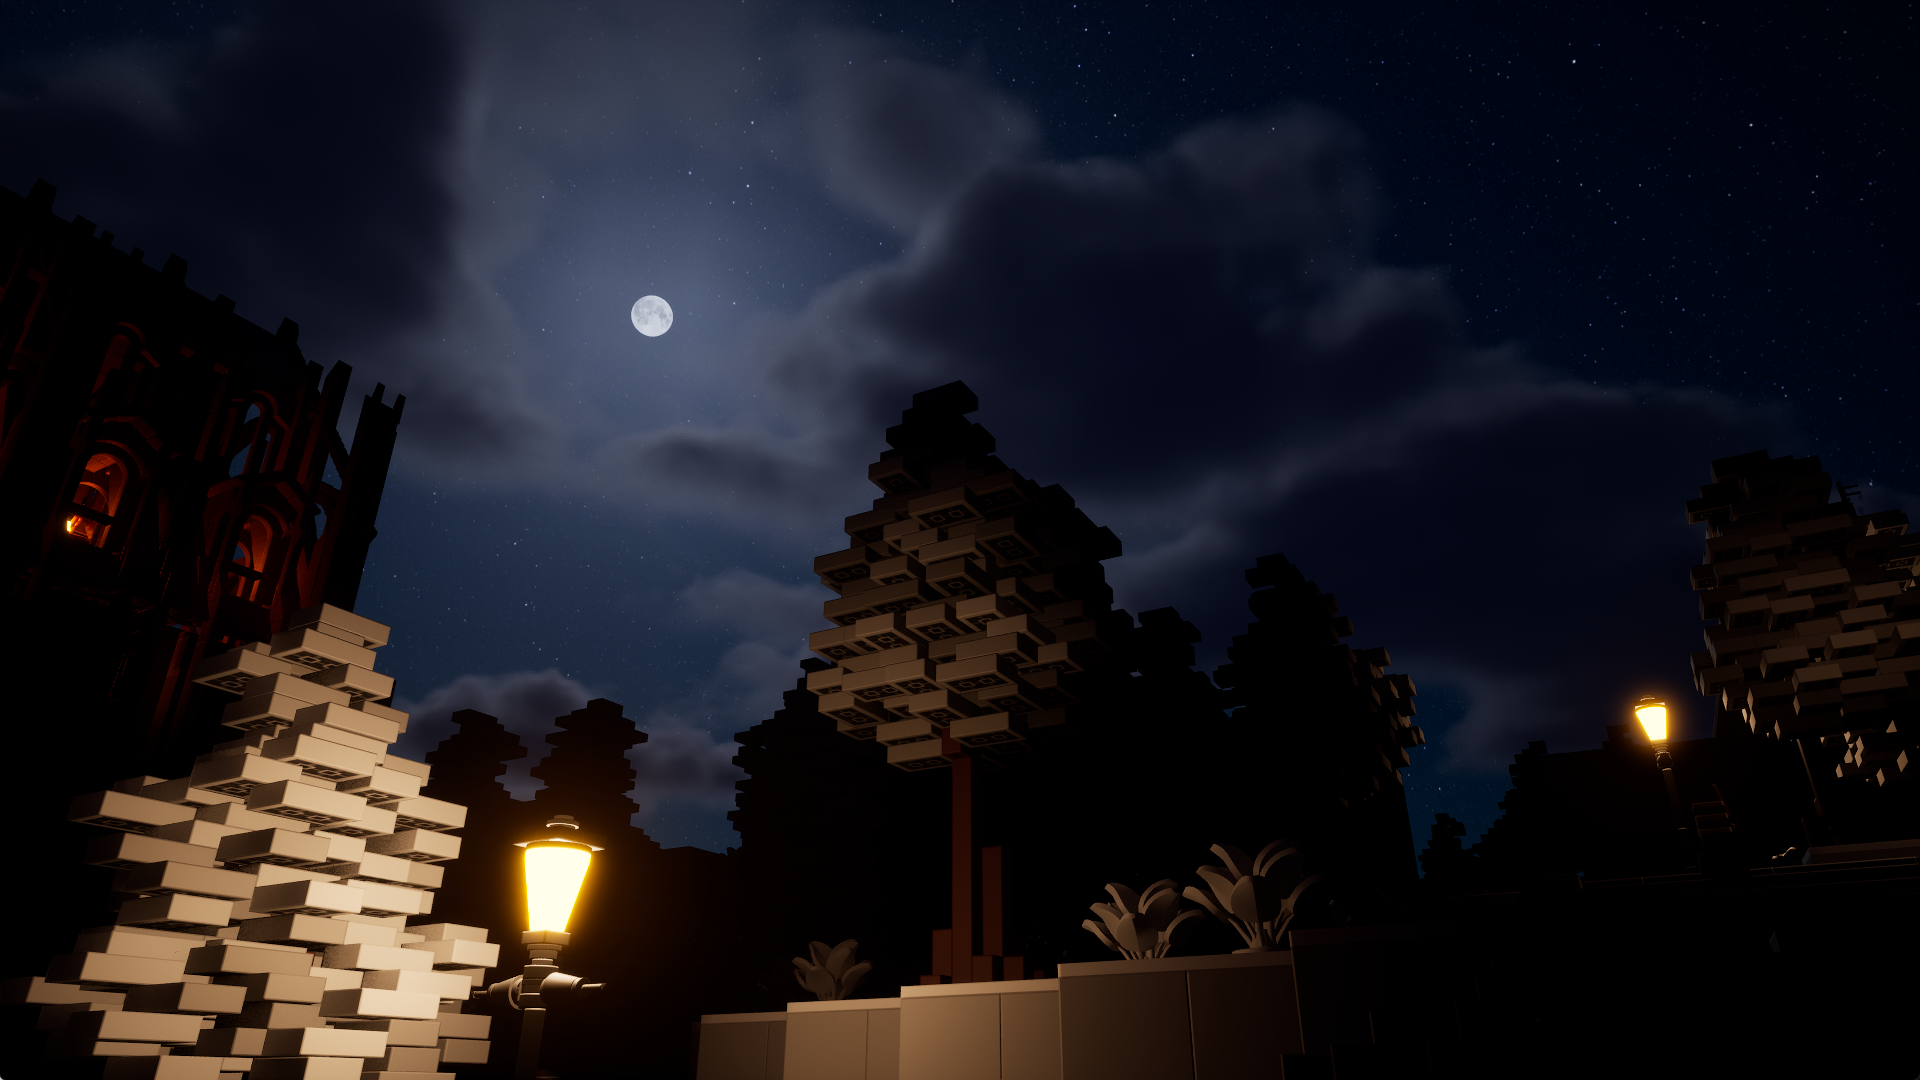
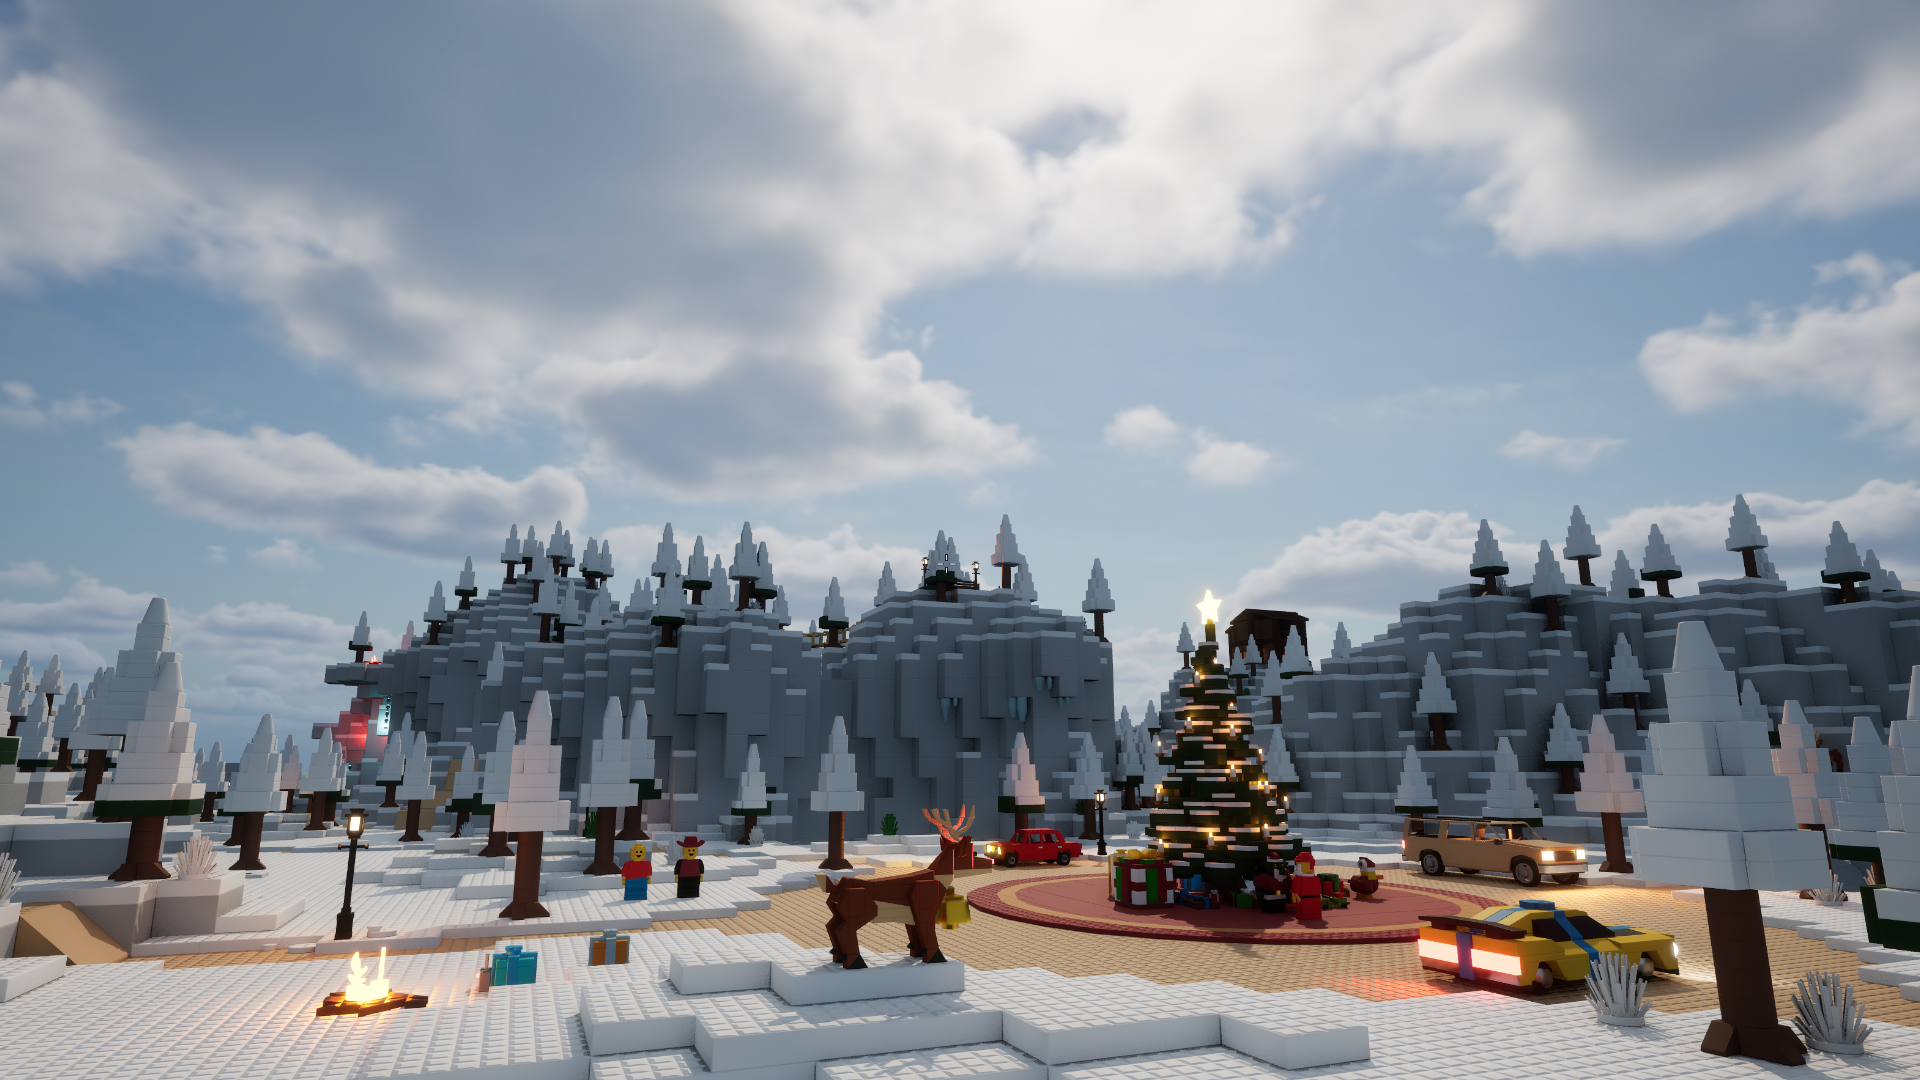
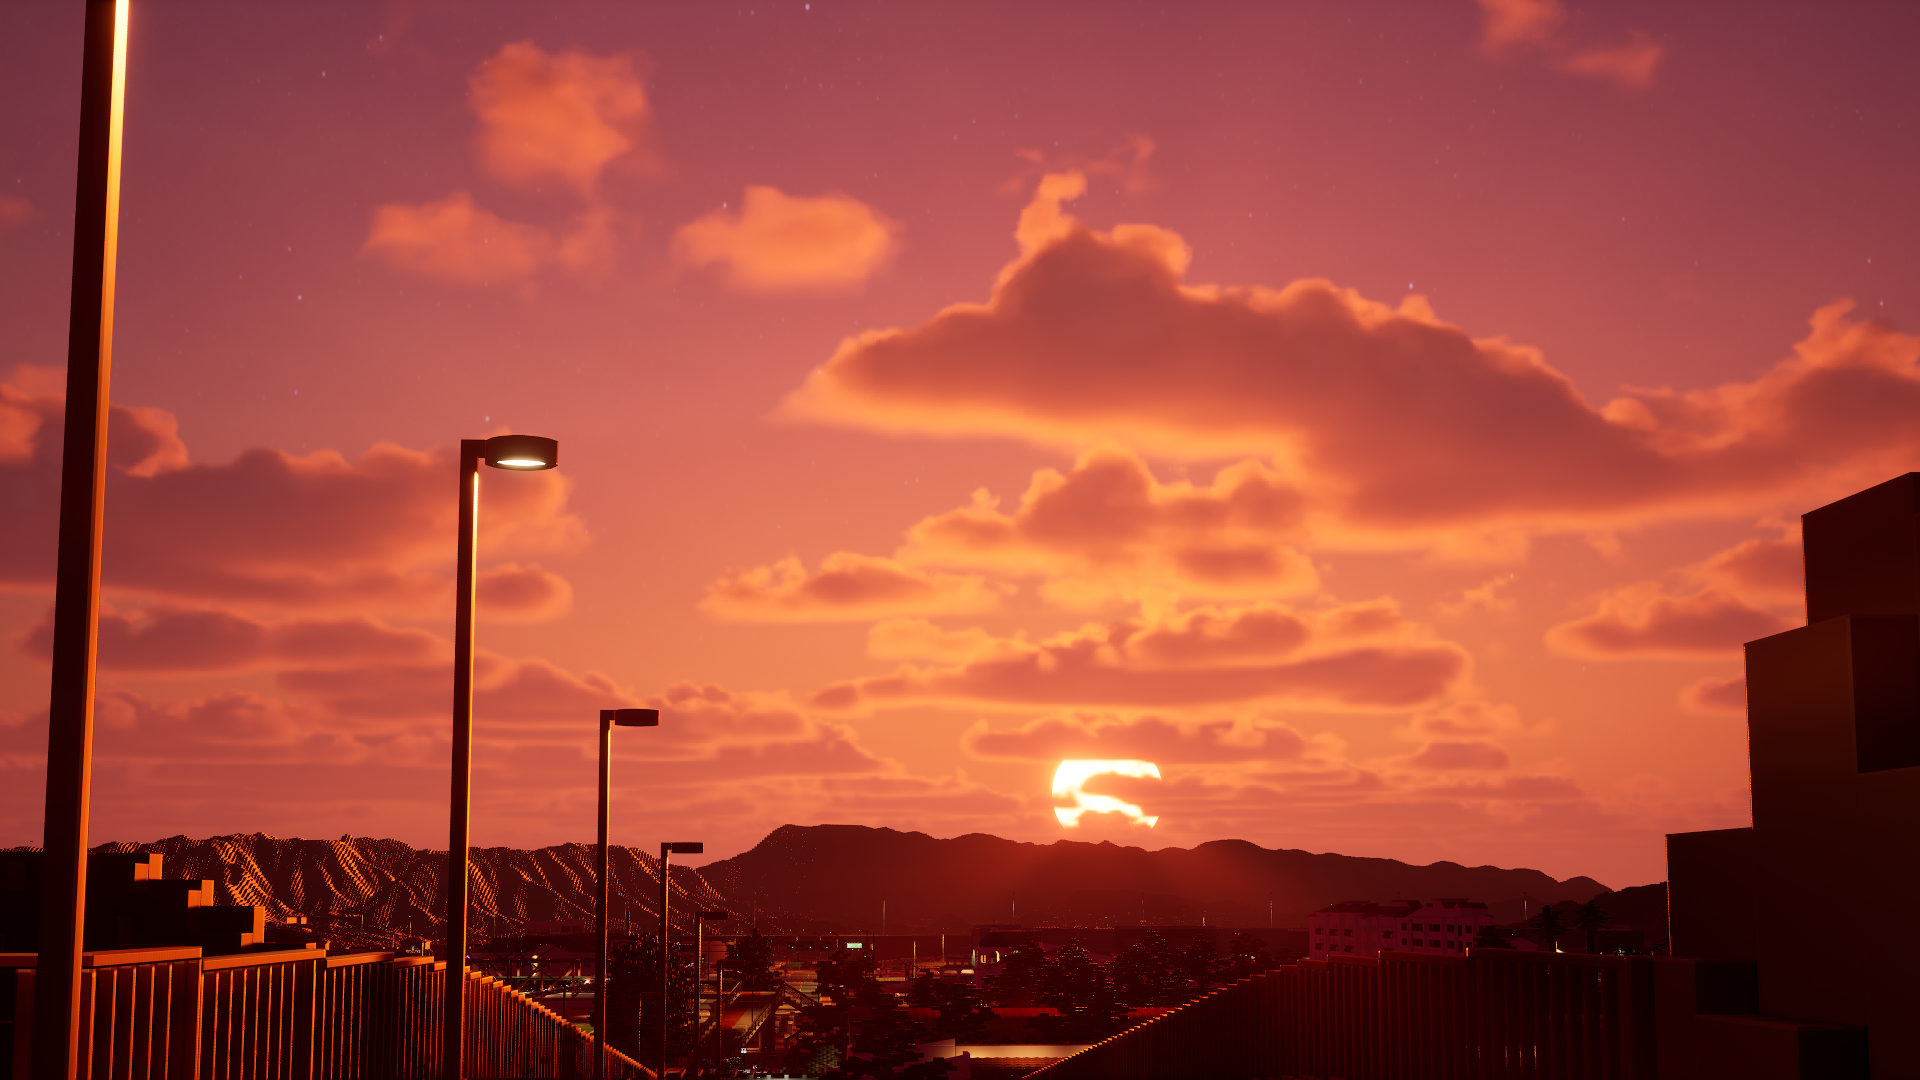
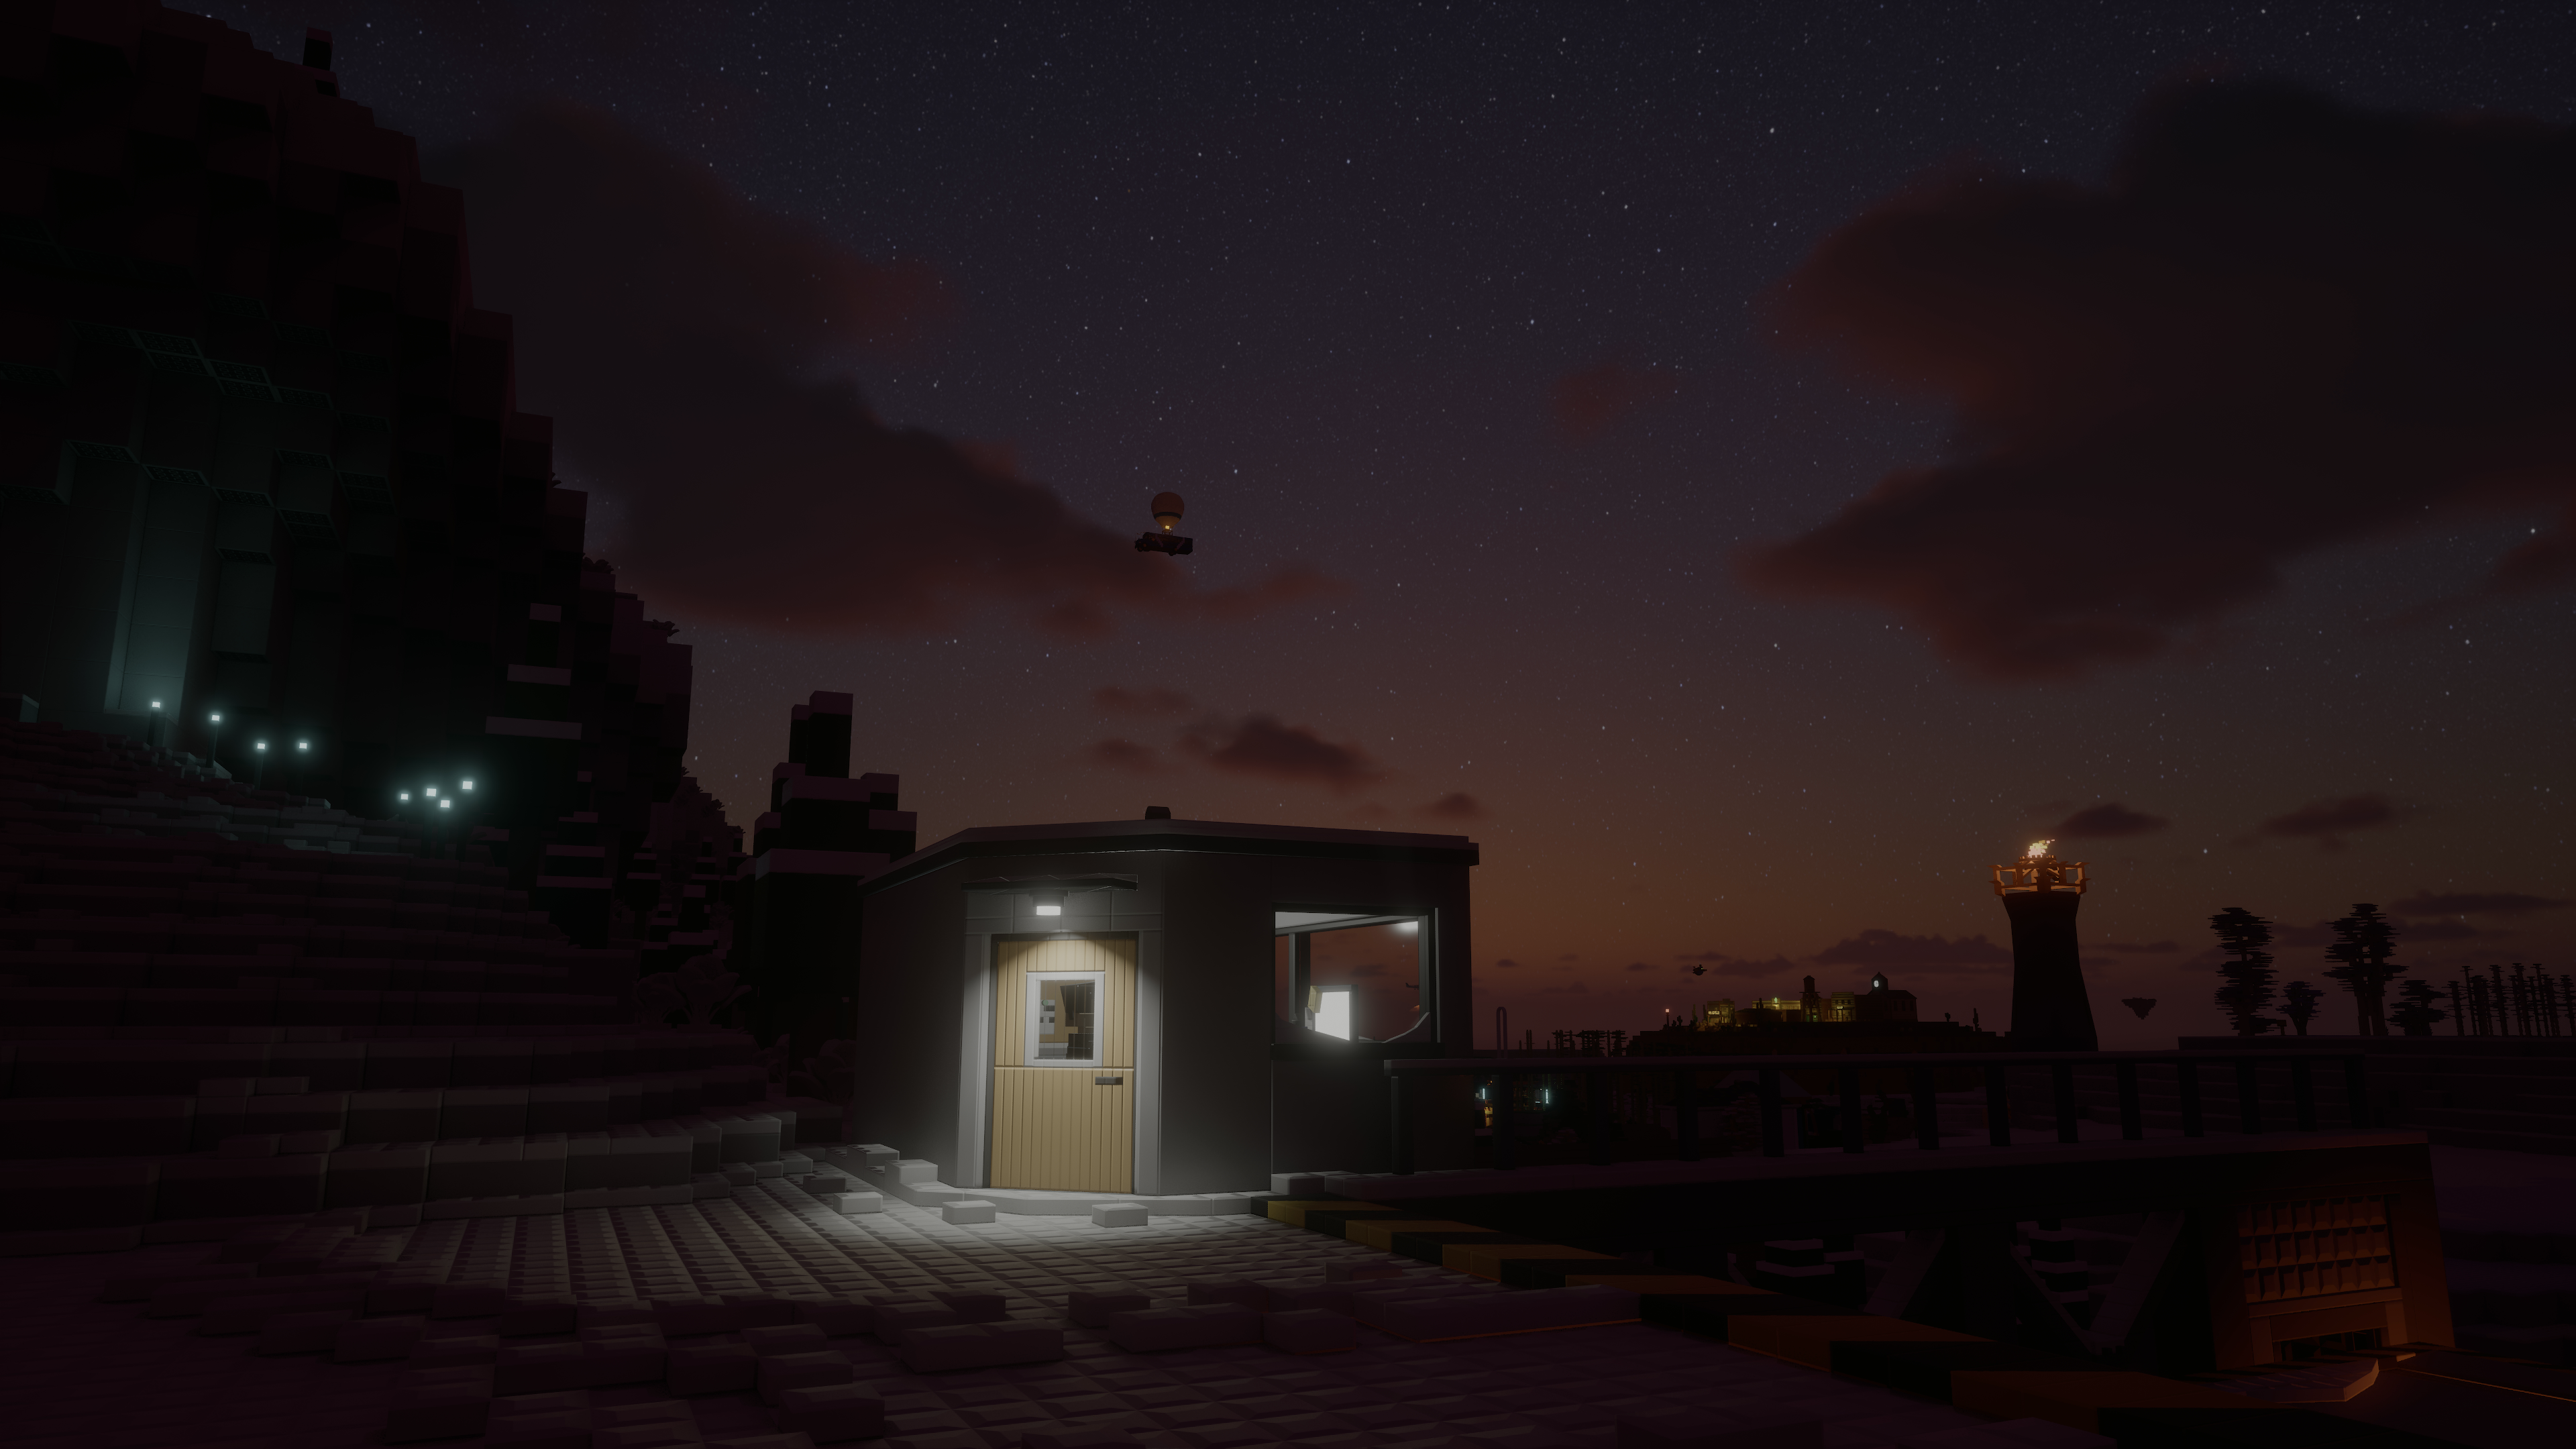
Much of the environment menu has been revamped to expose new features. For example, you can now control the day/night cycle more sensibly.
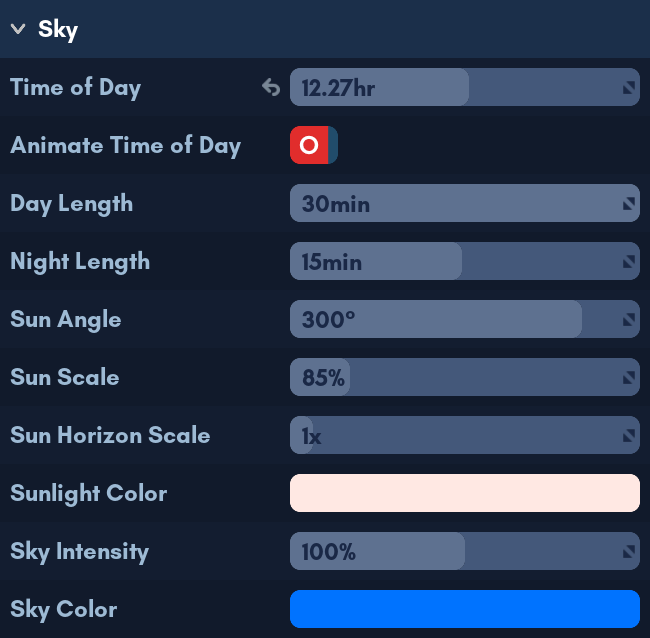
You have much more control over the night sky now with extra moon settings.
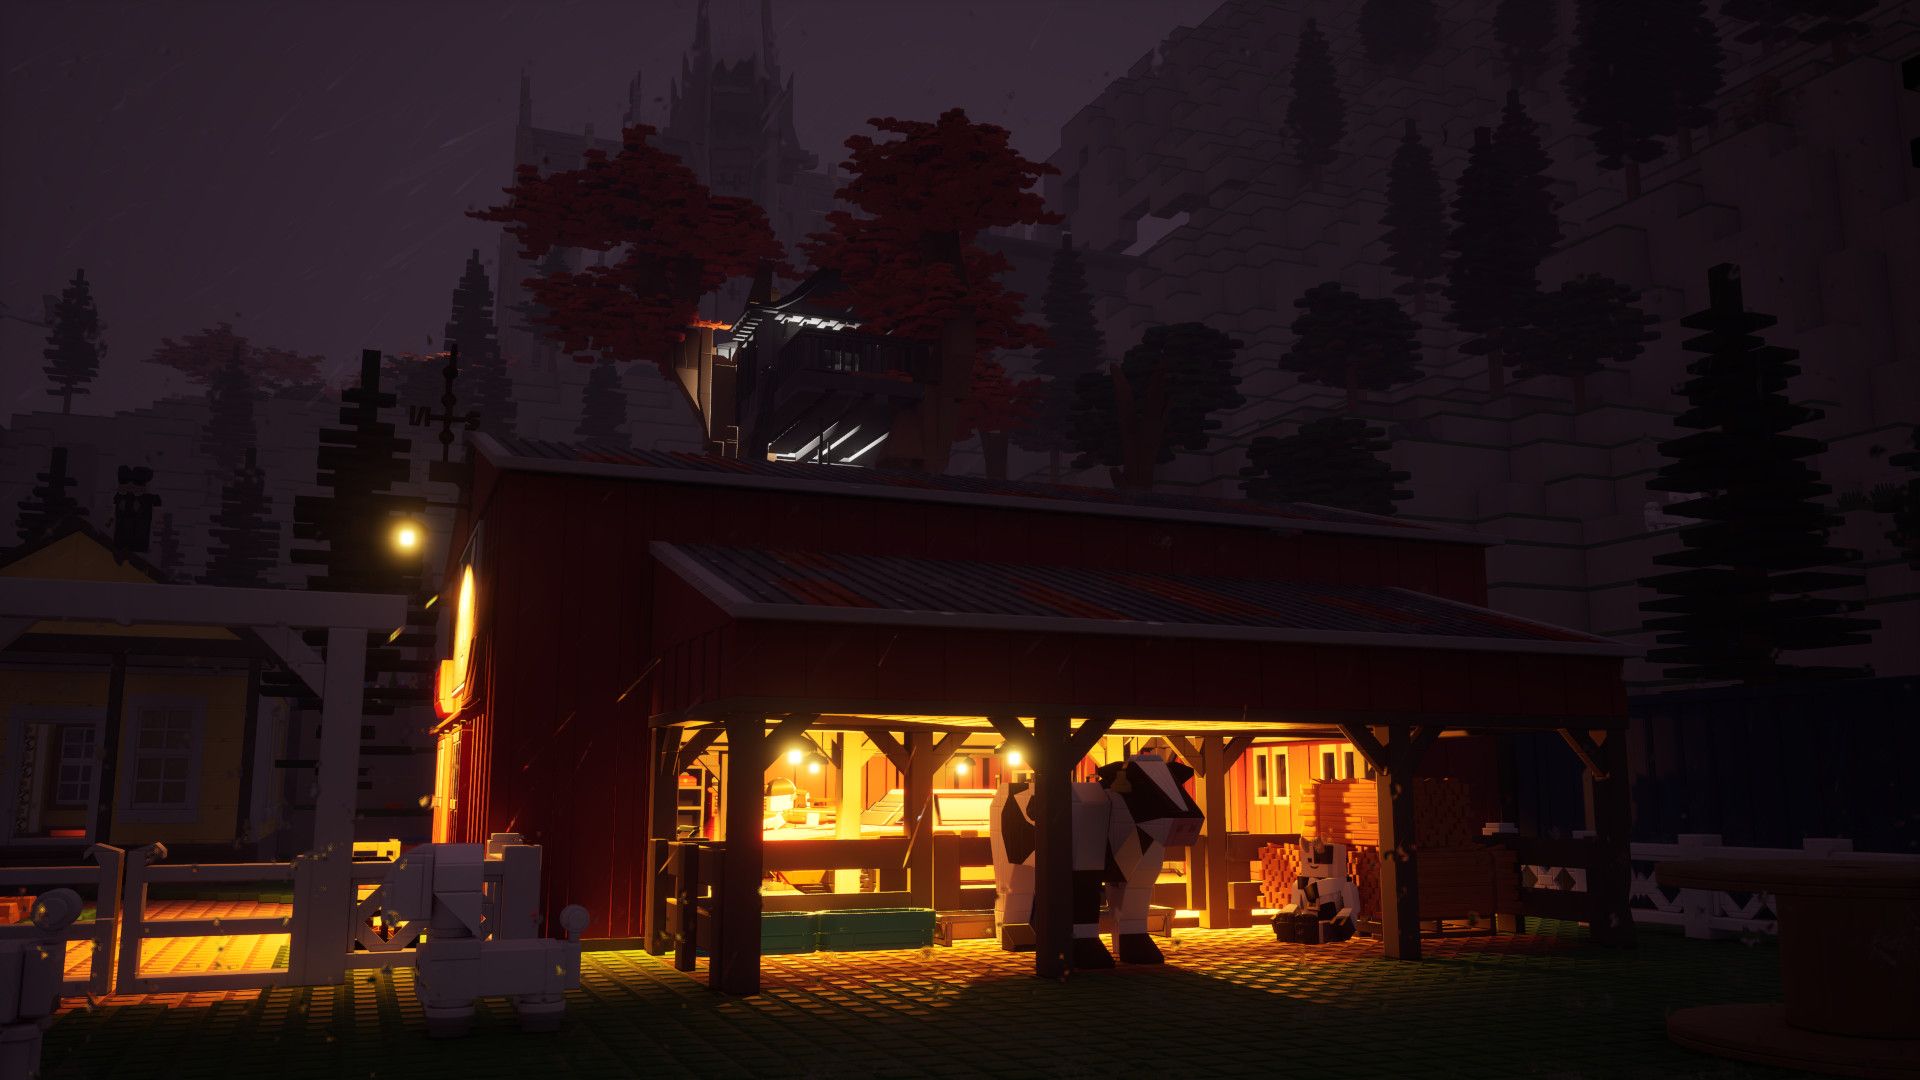
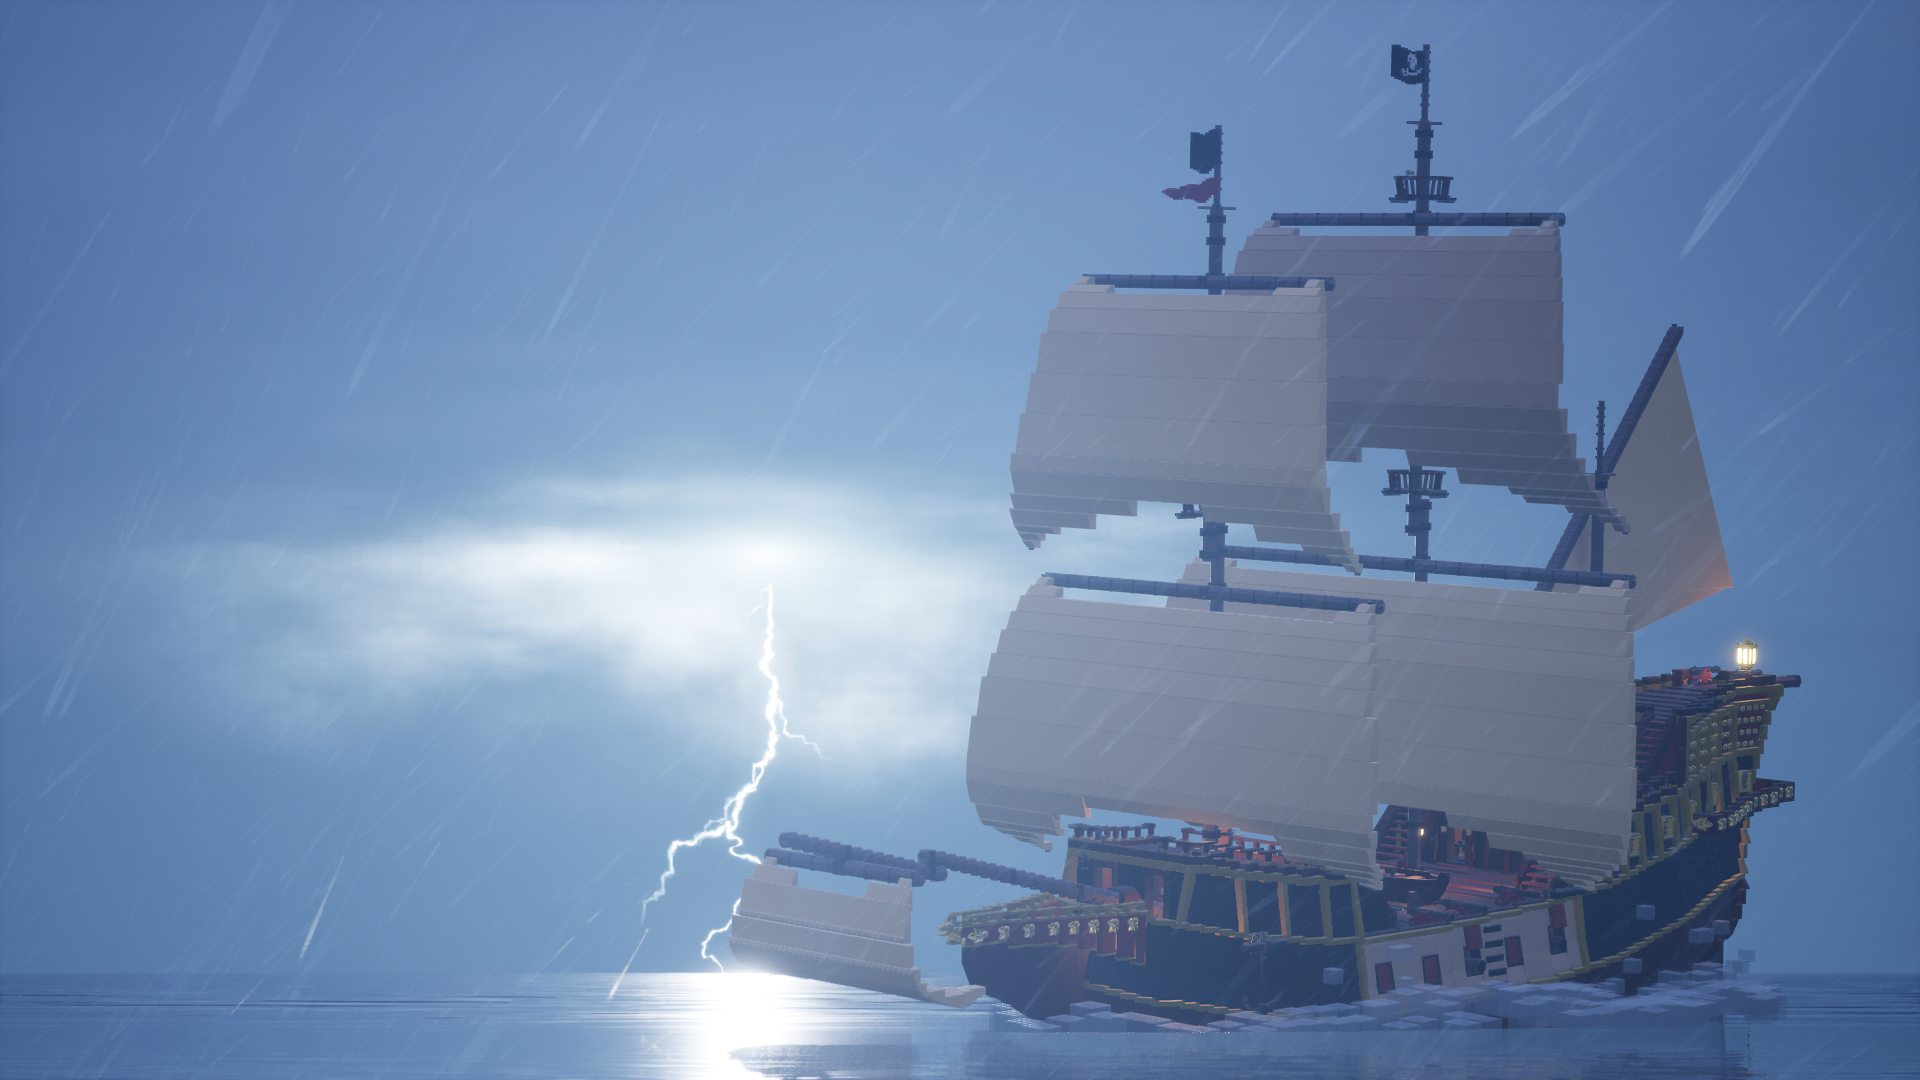
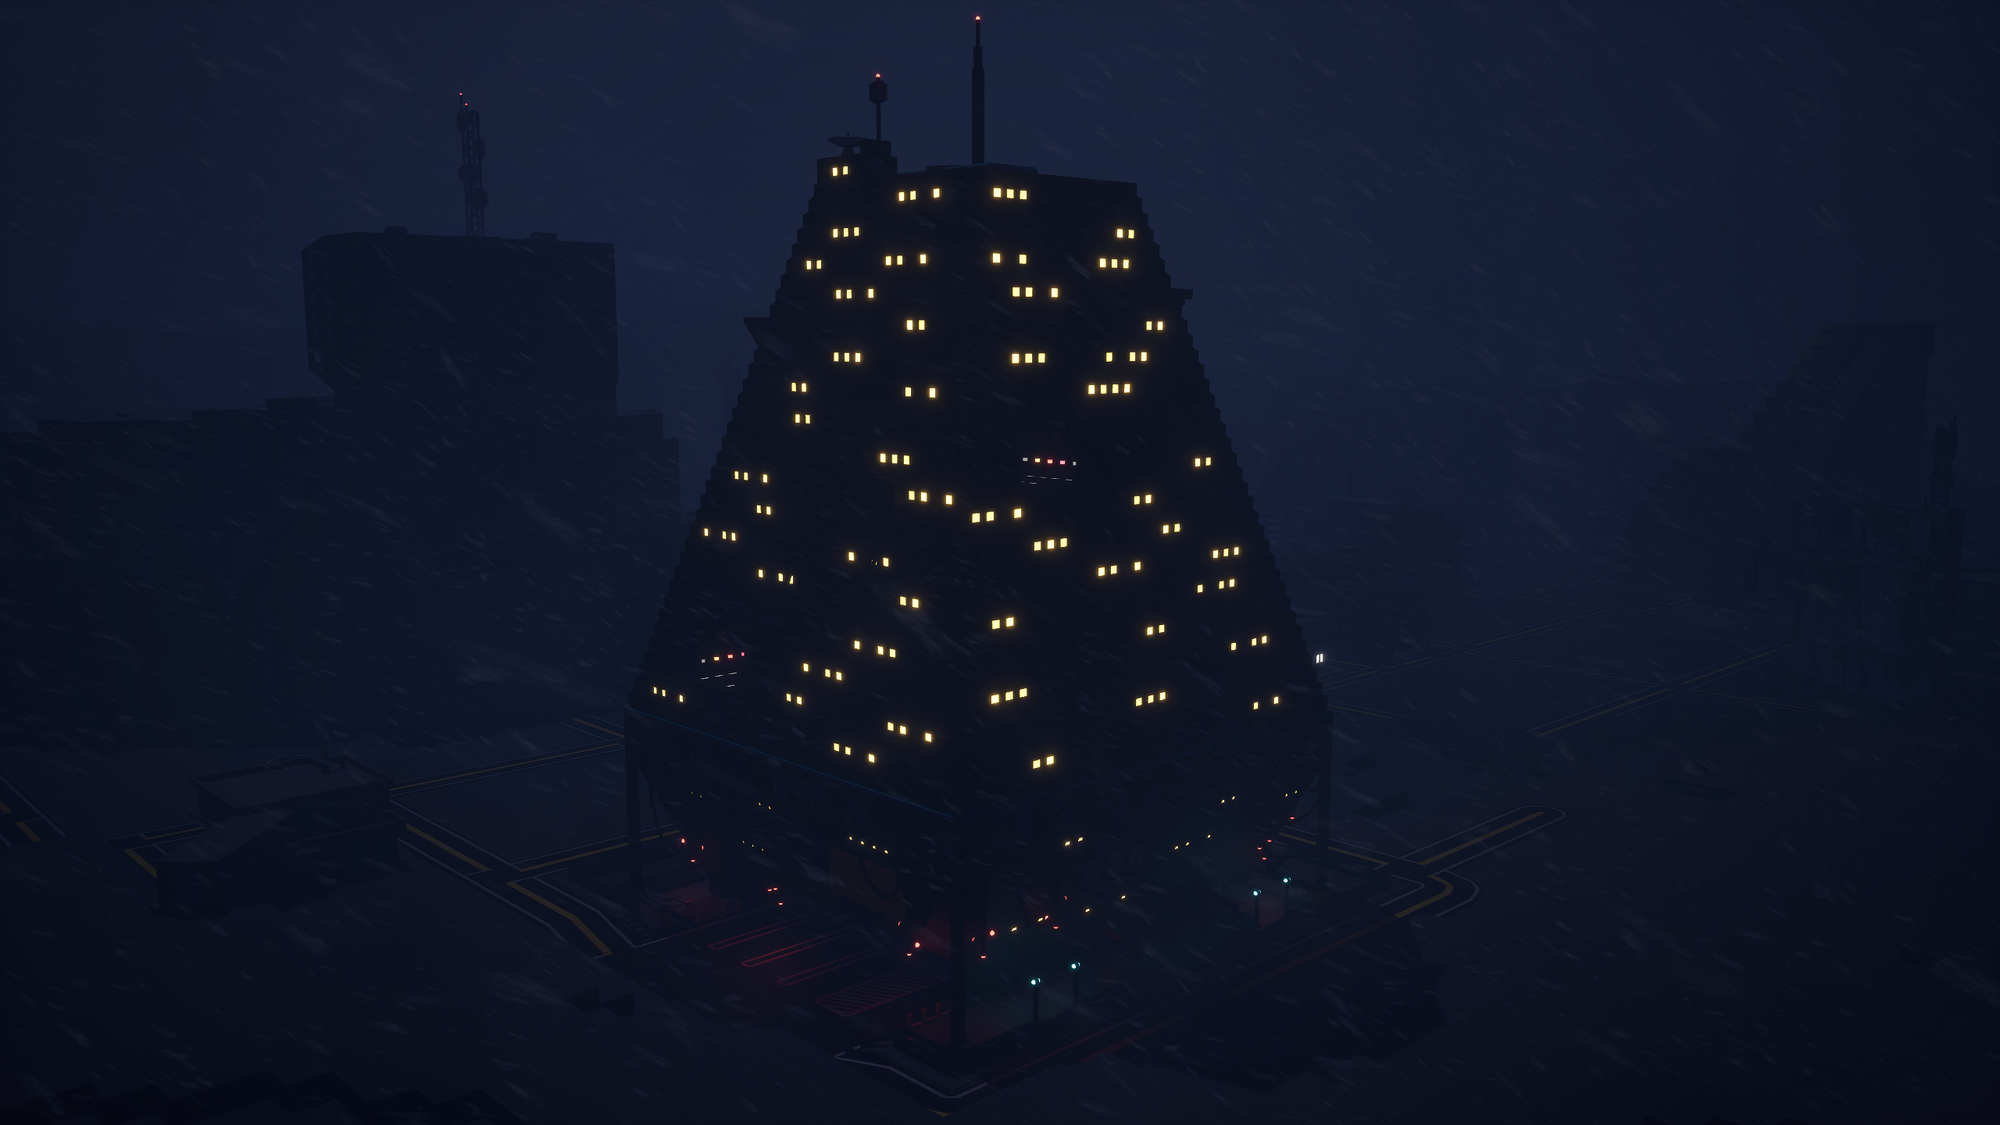
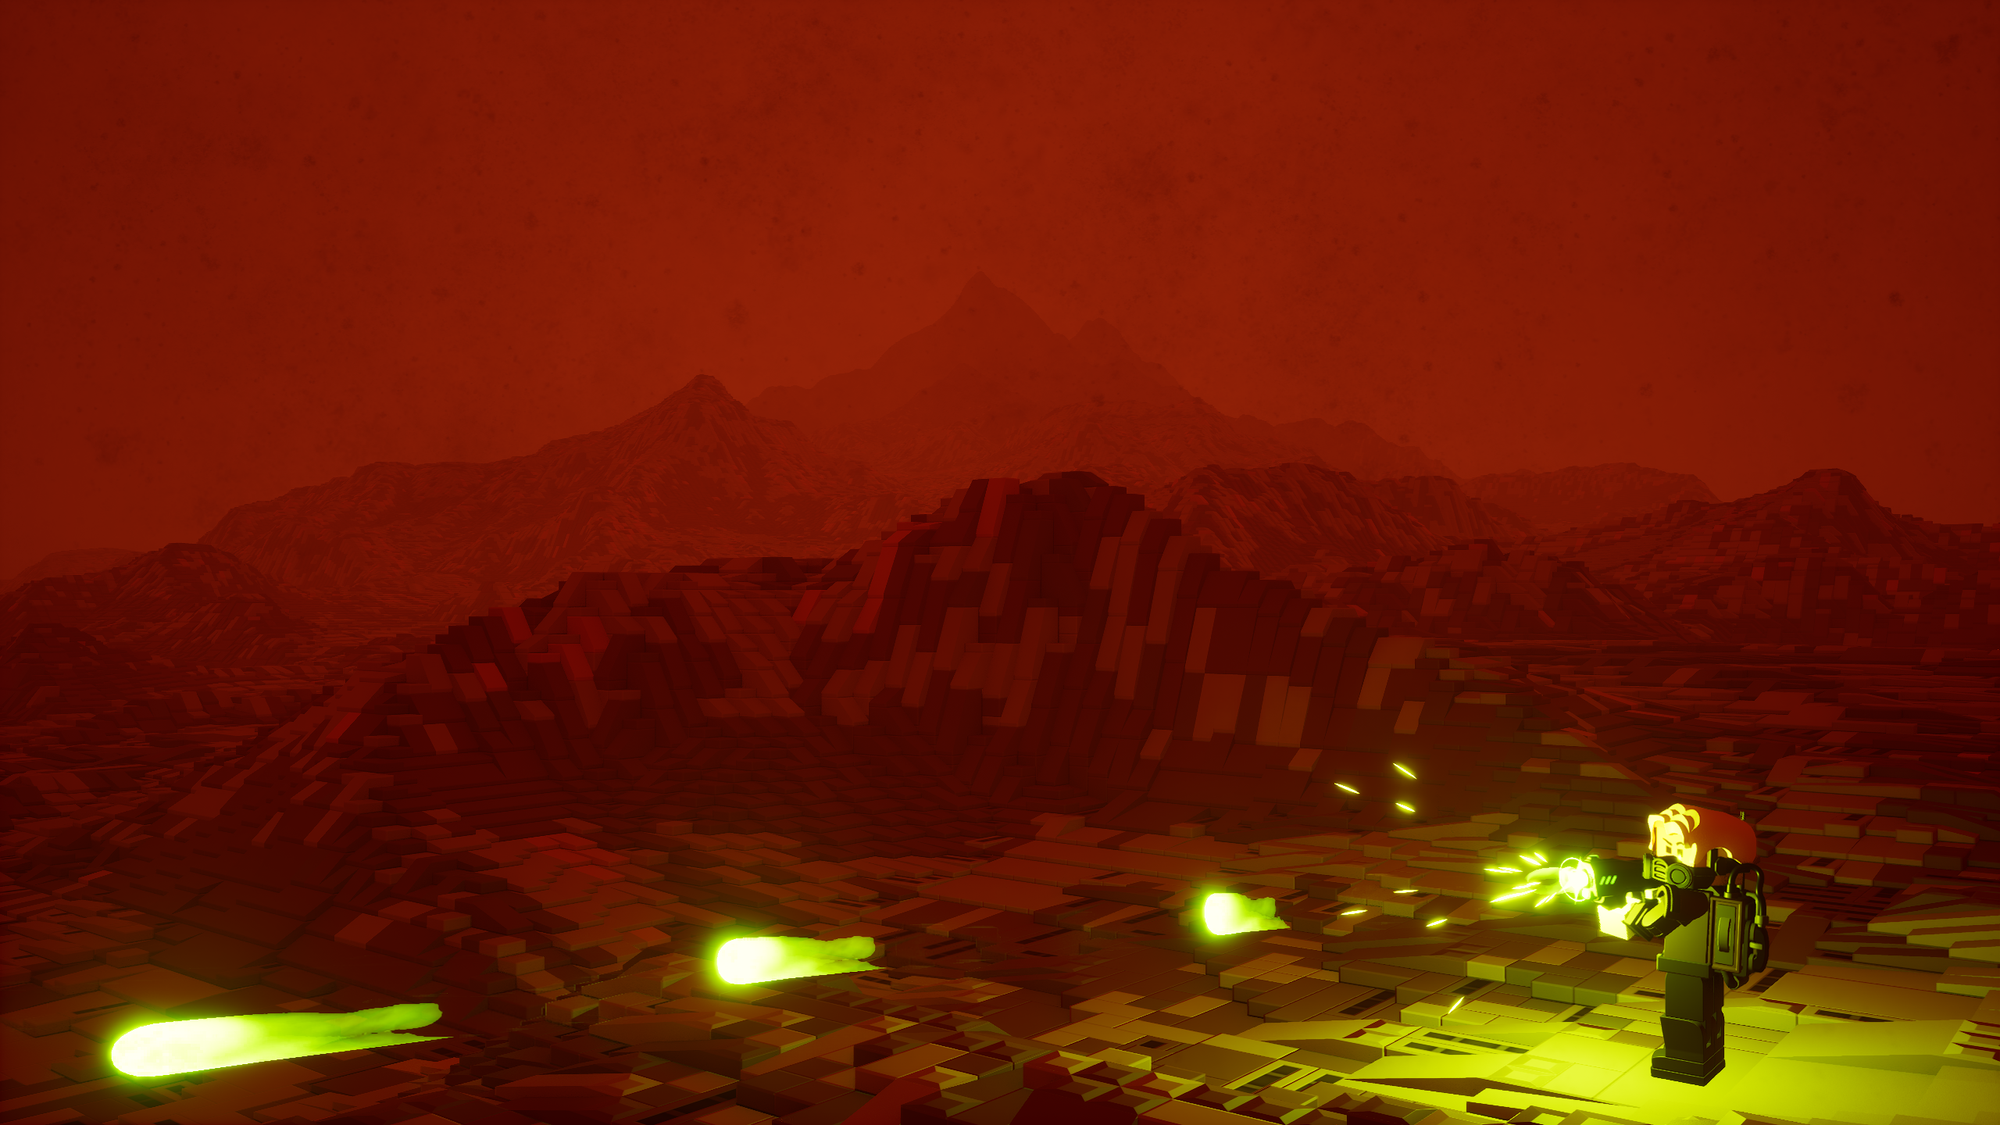
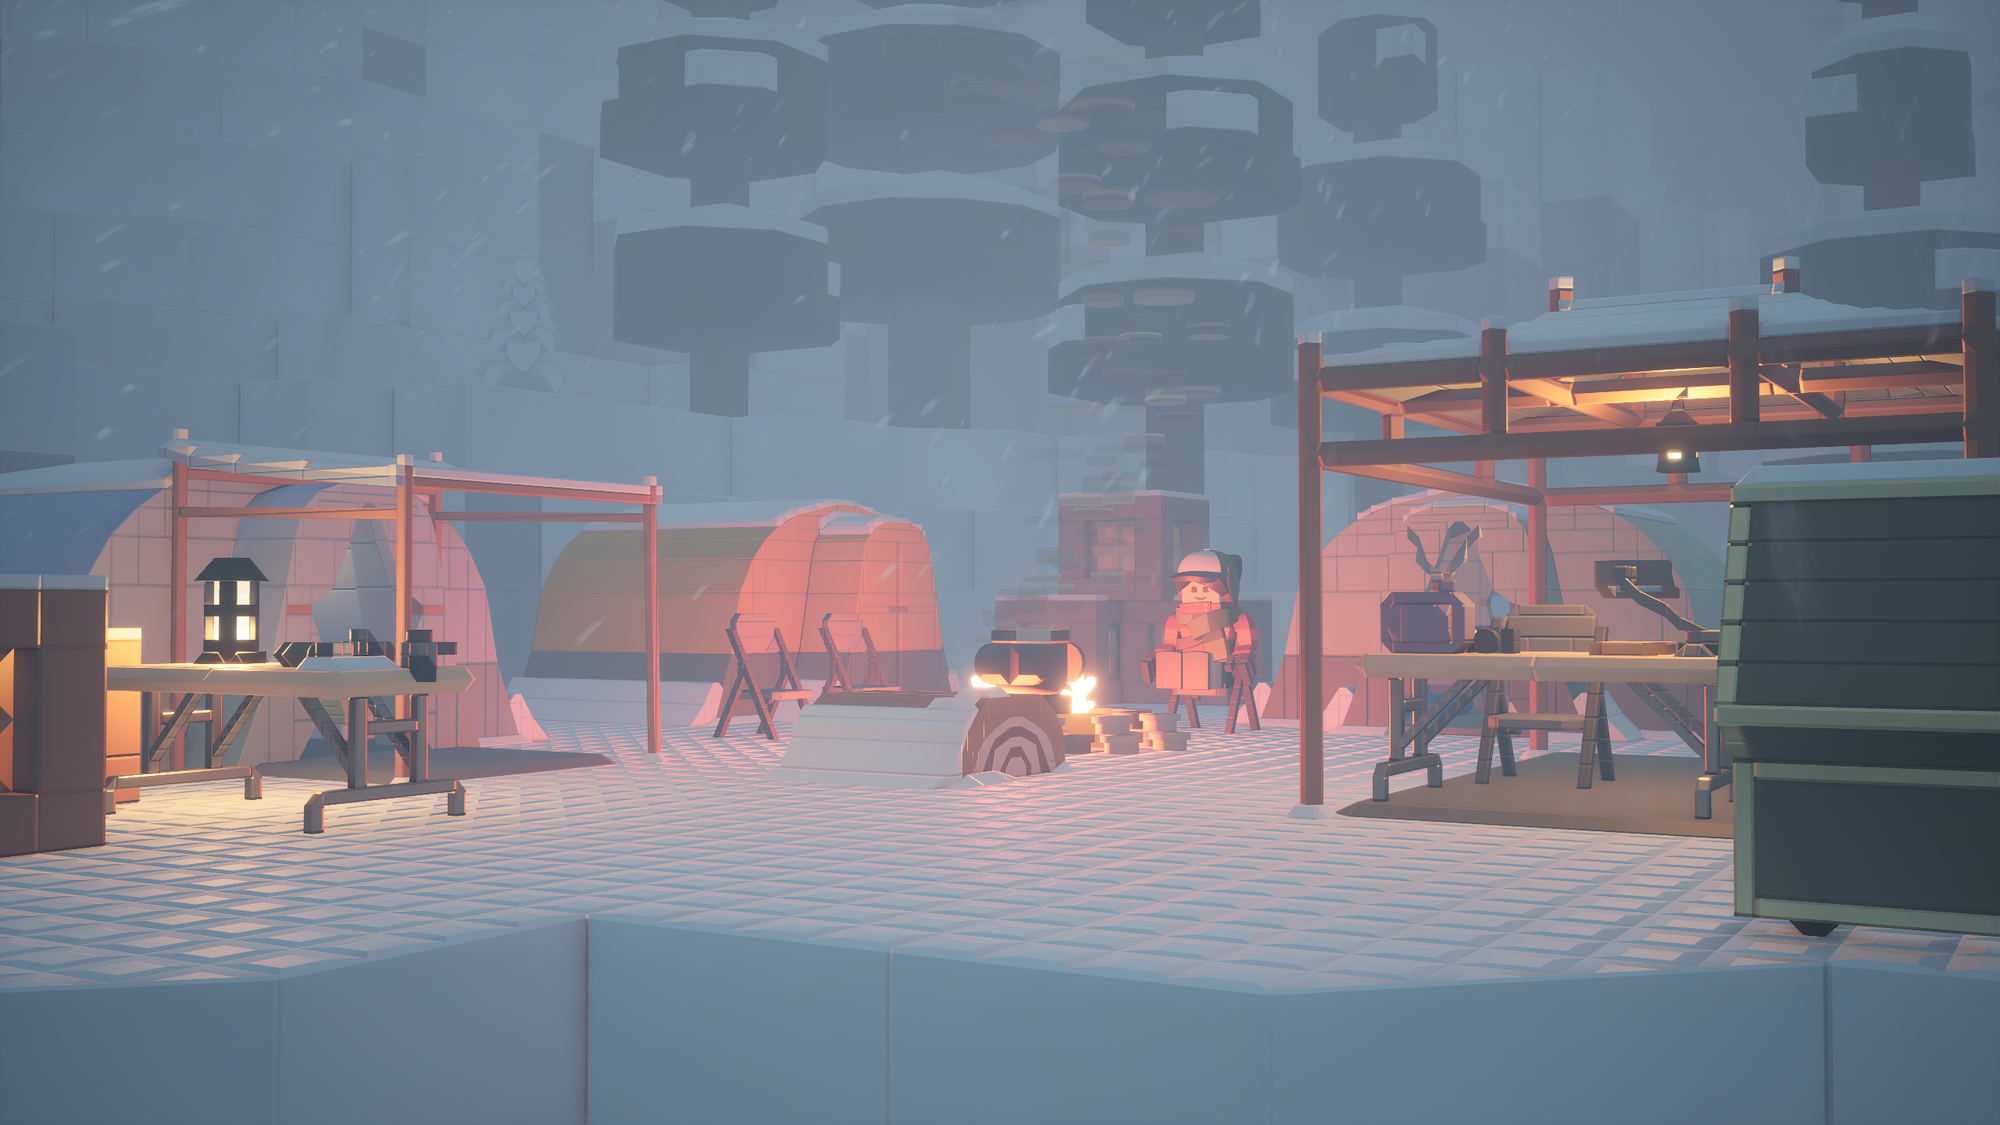
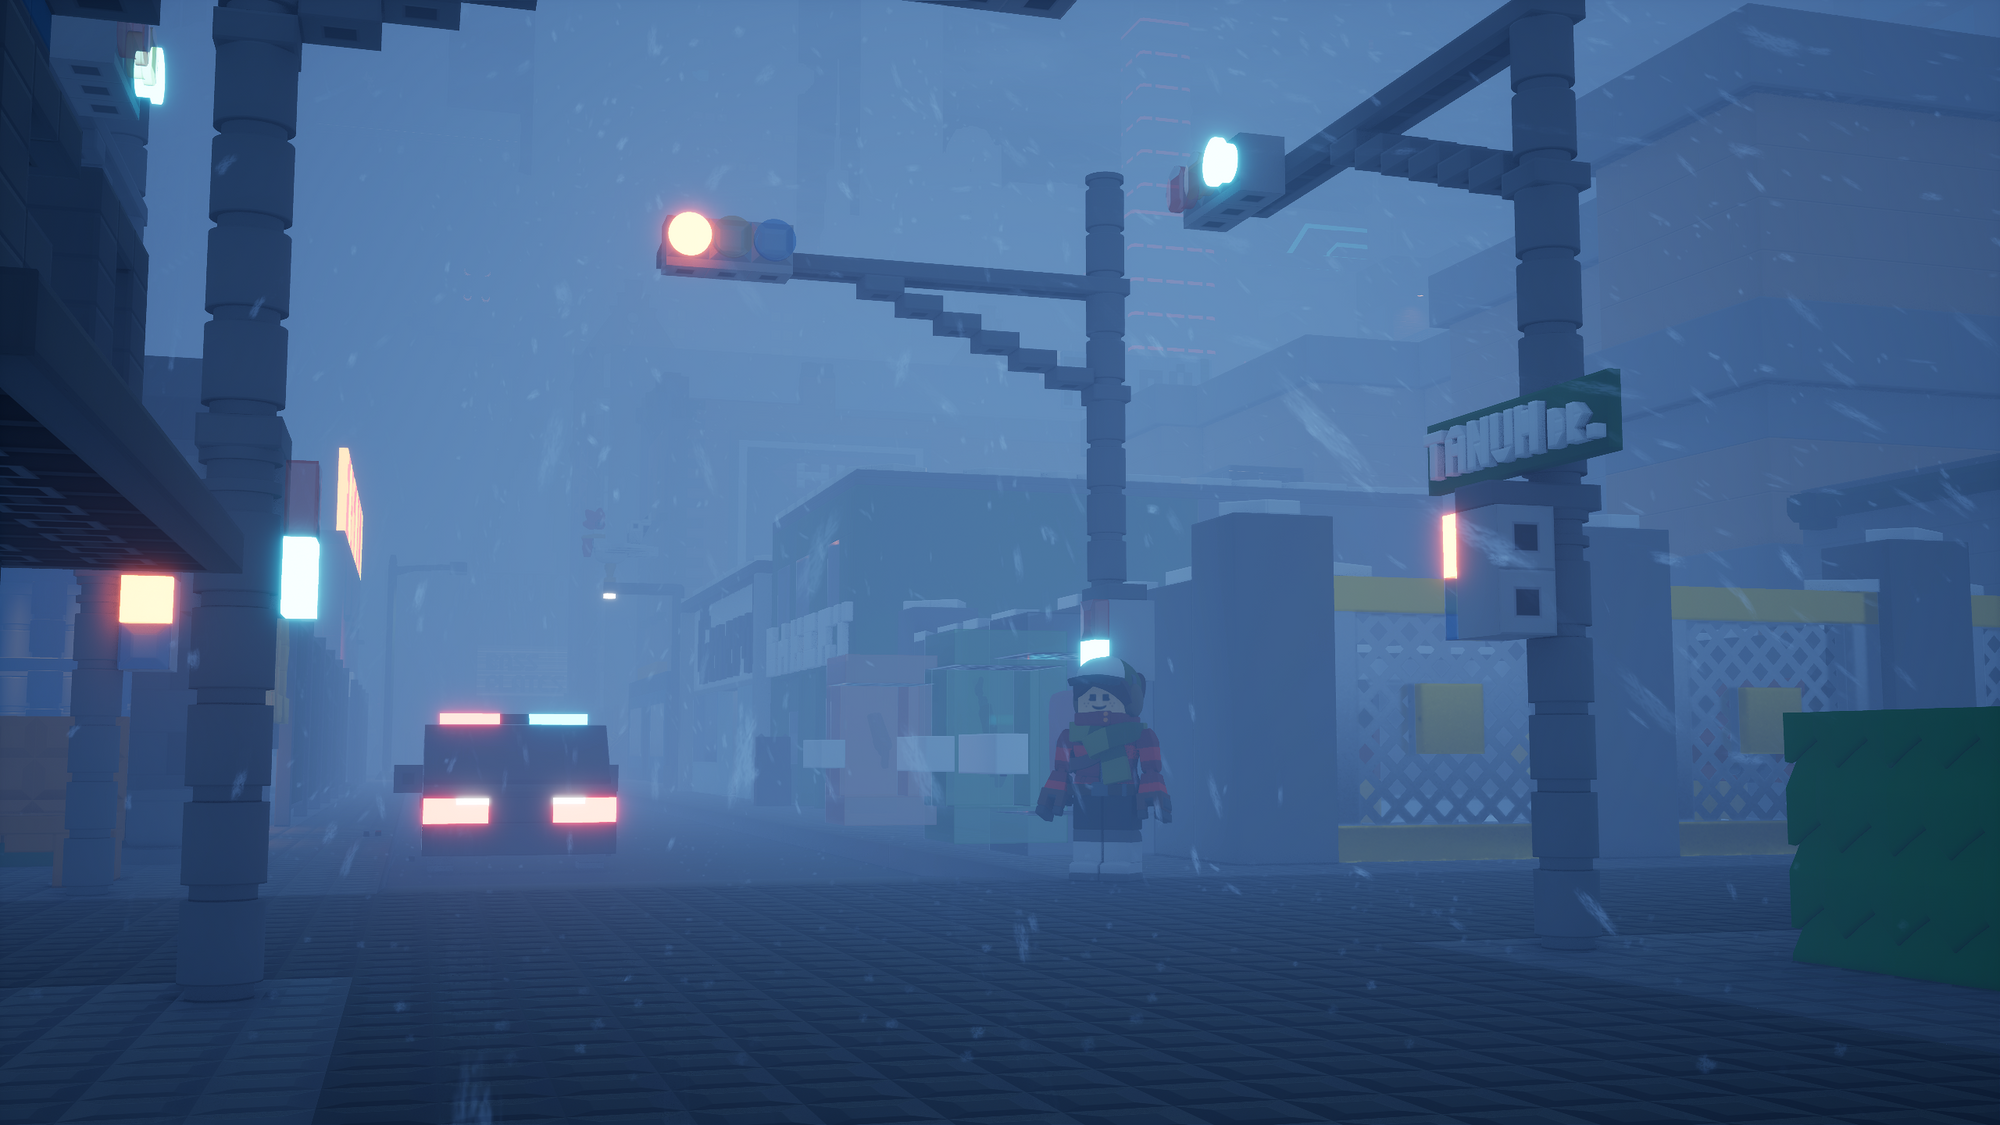
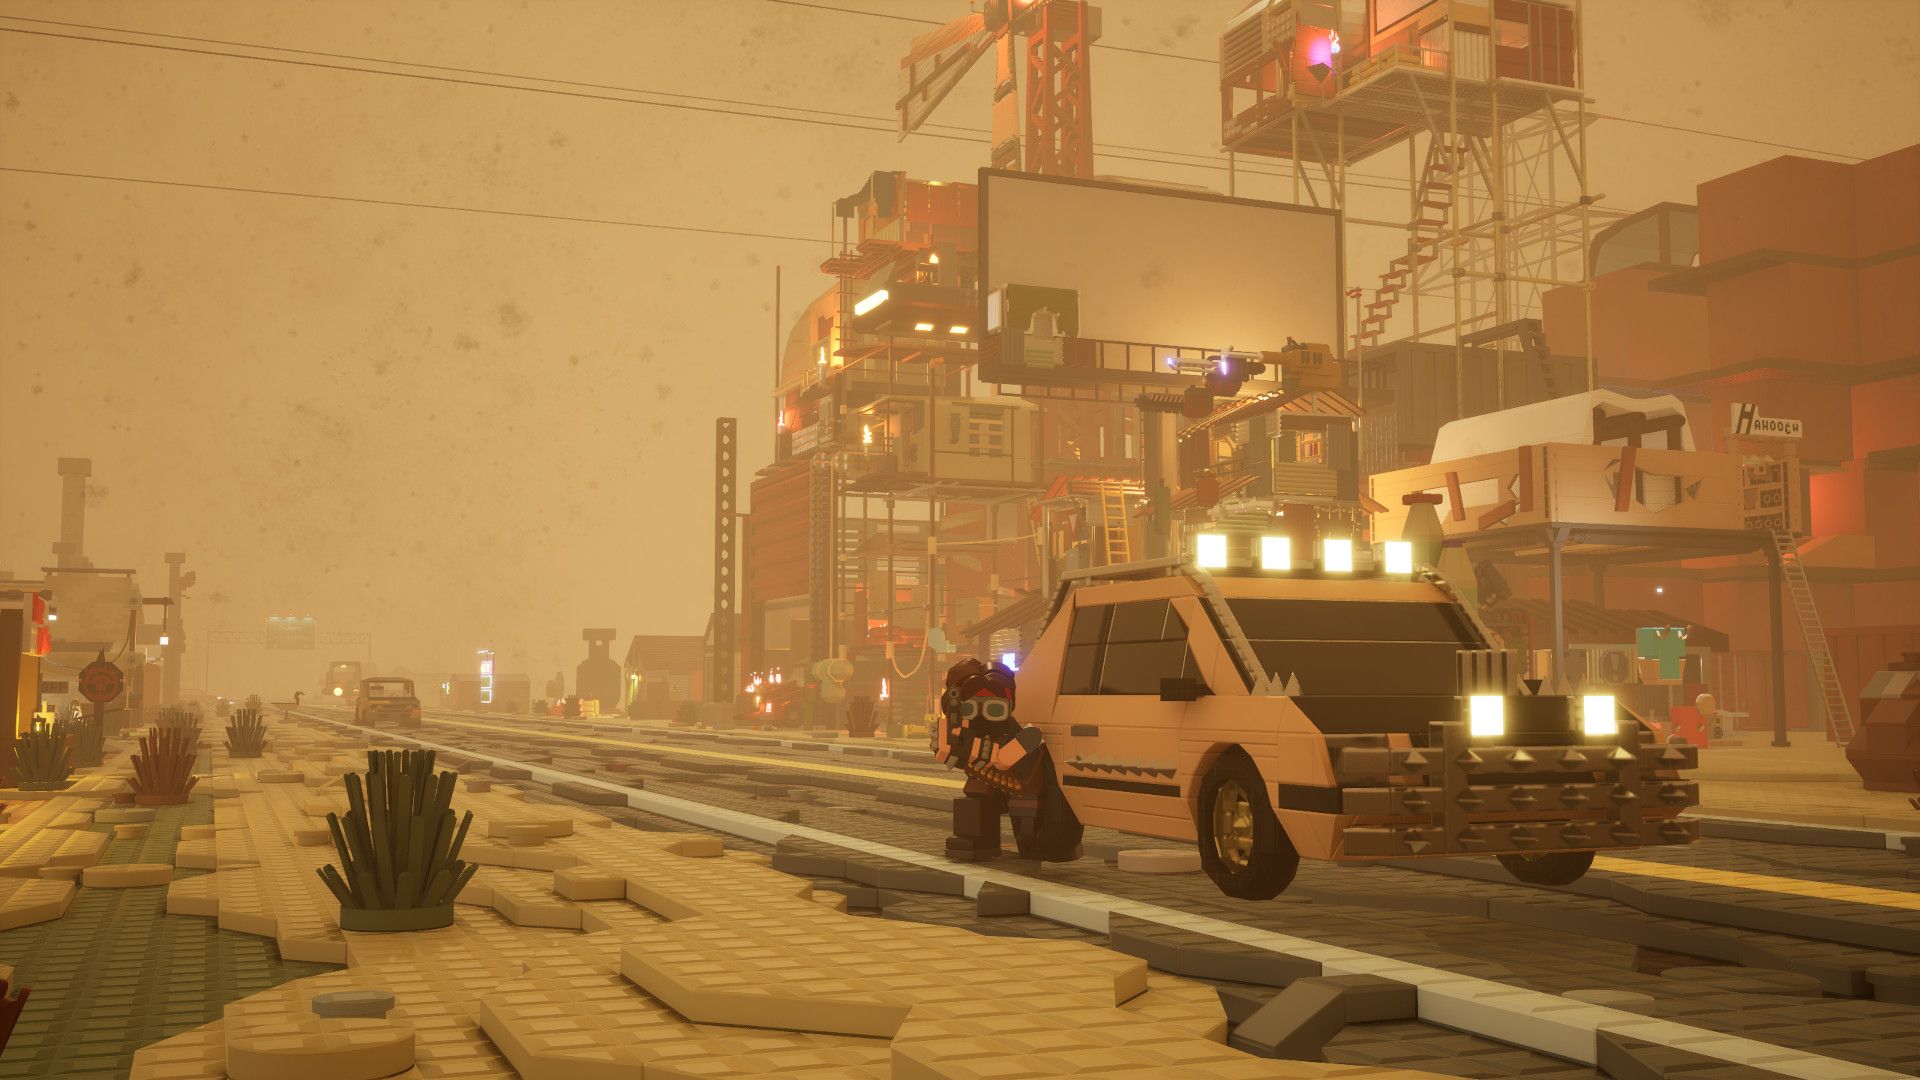
Weather effects can now be individually controlled, and there's a new one, too.
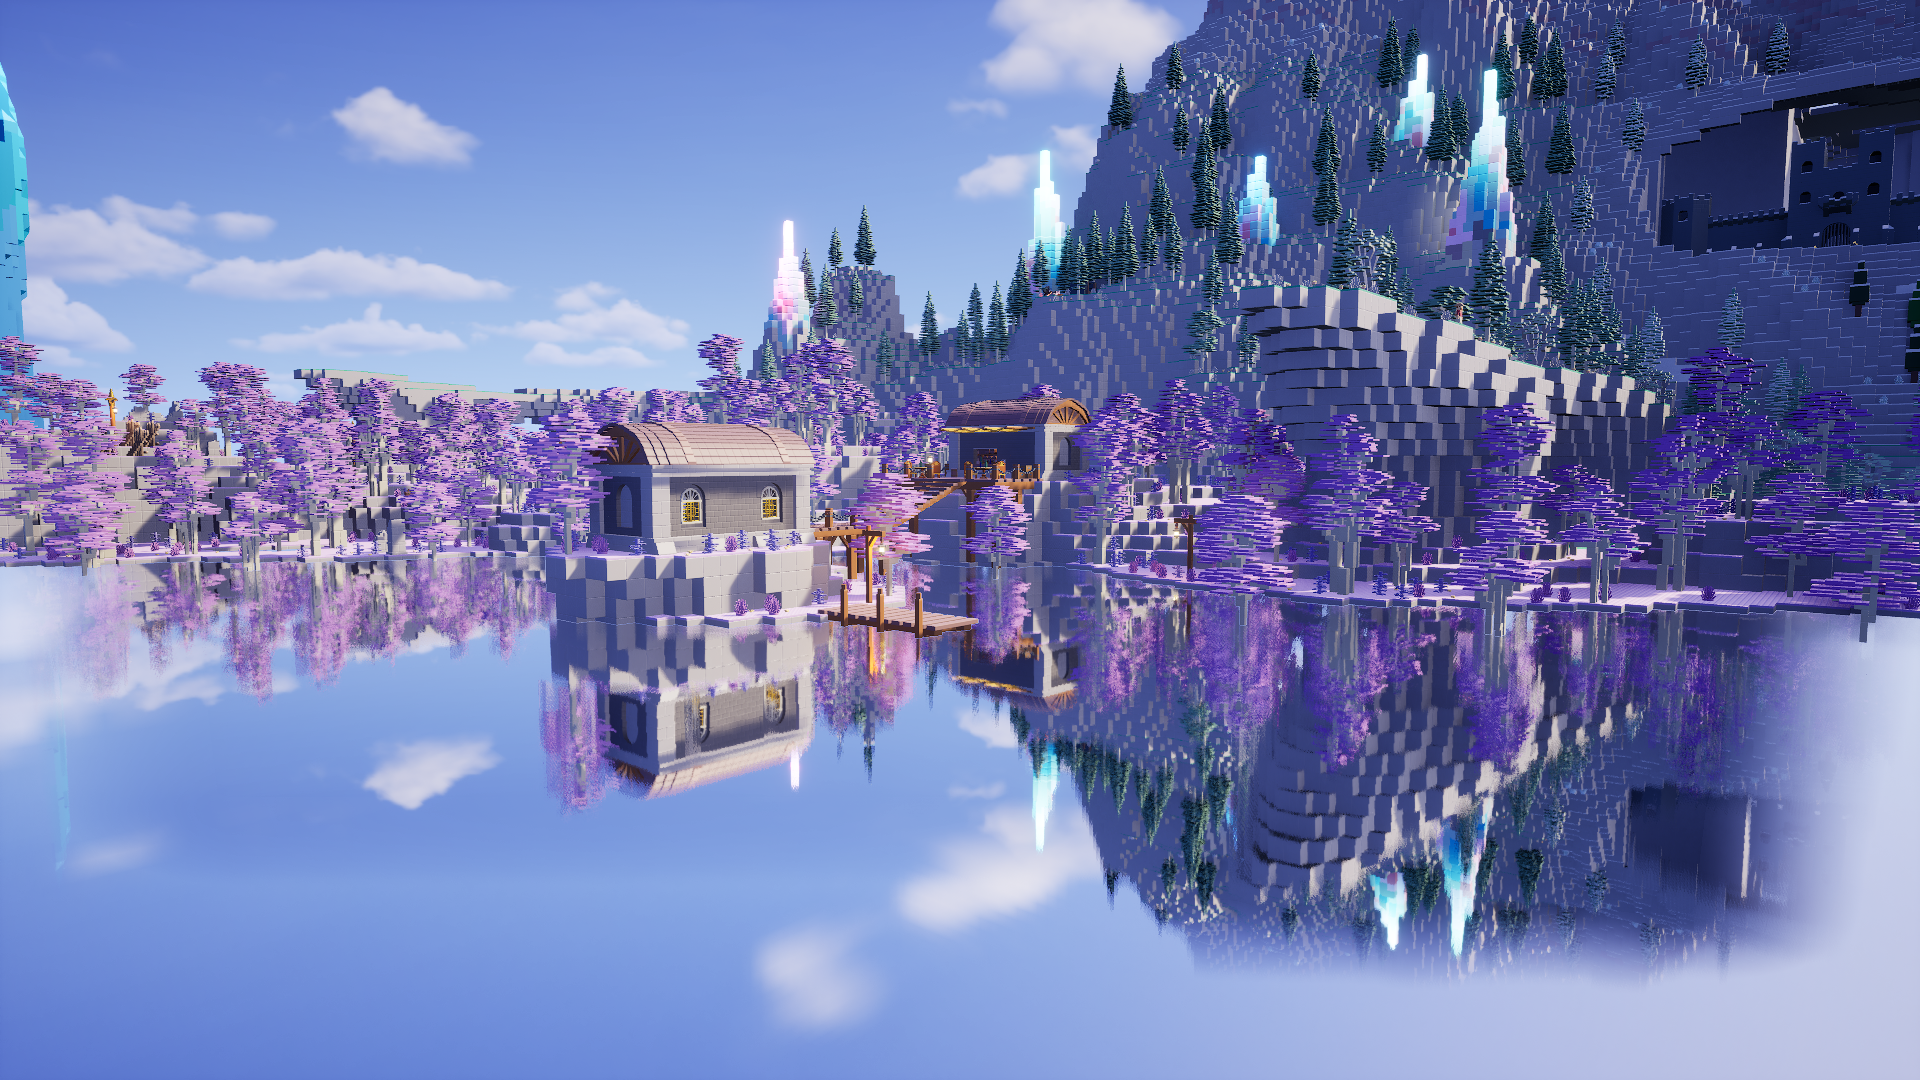
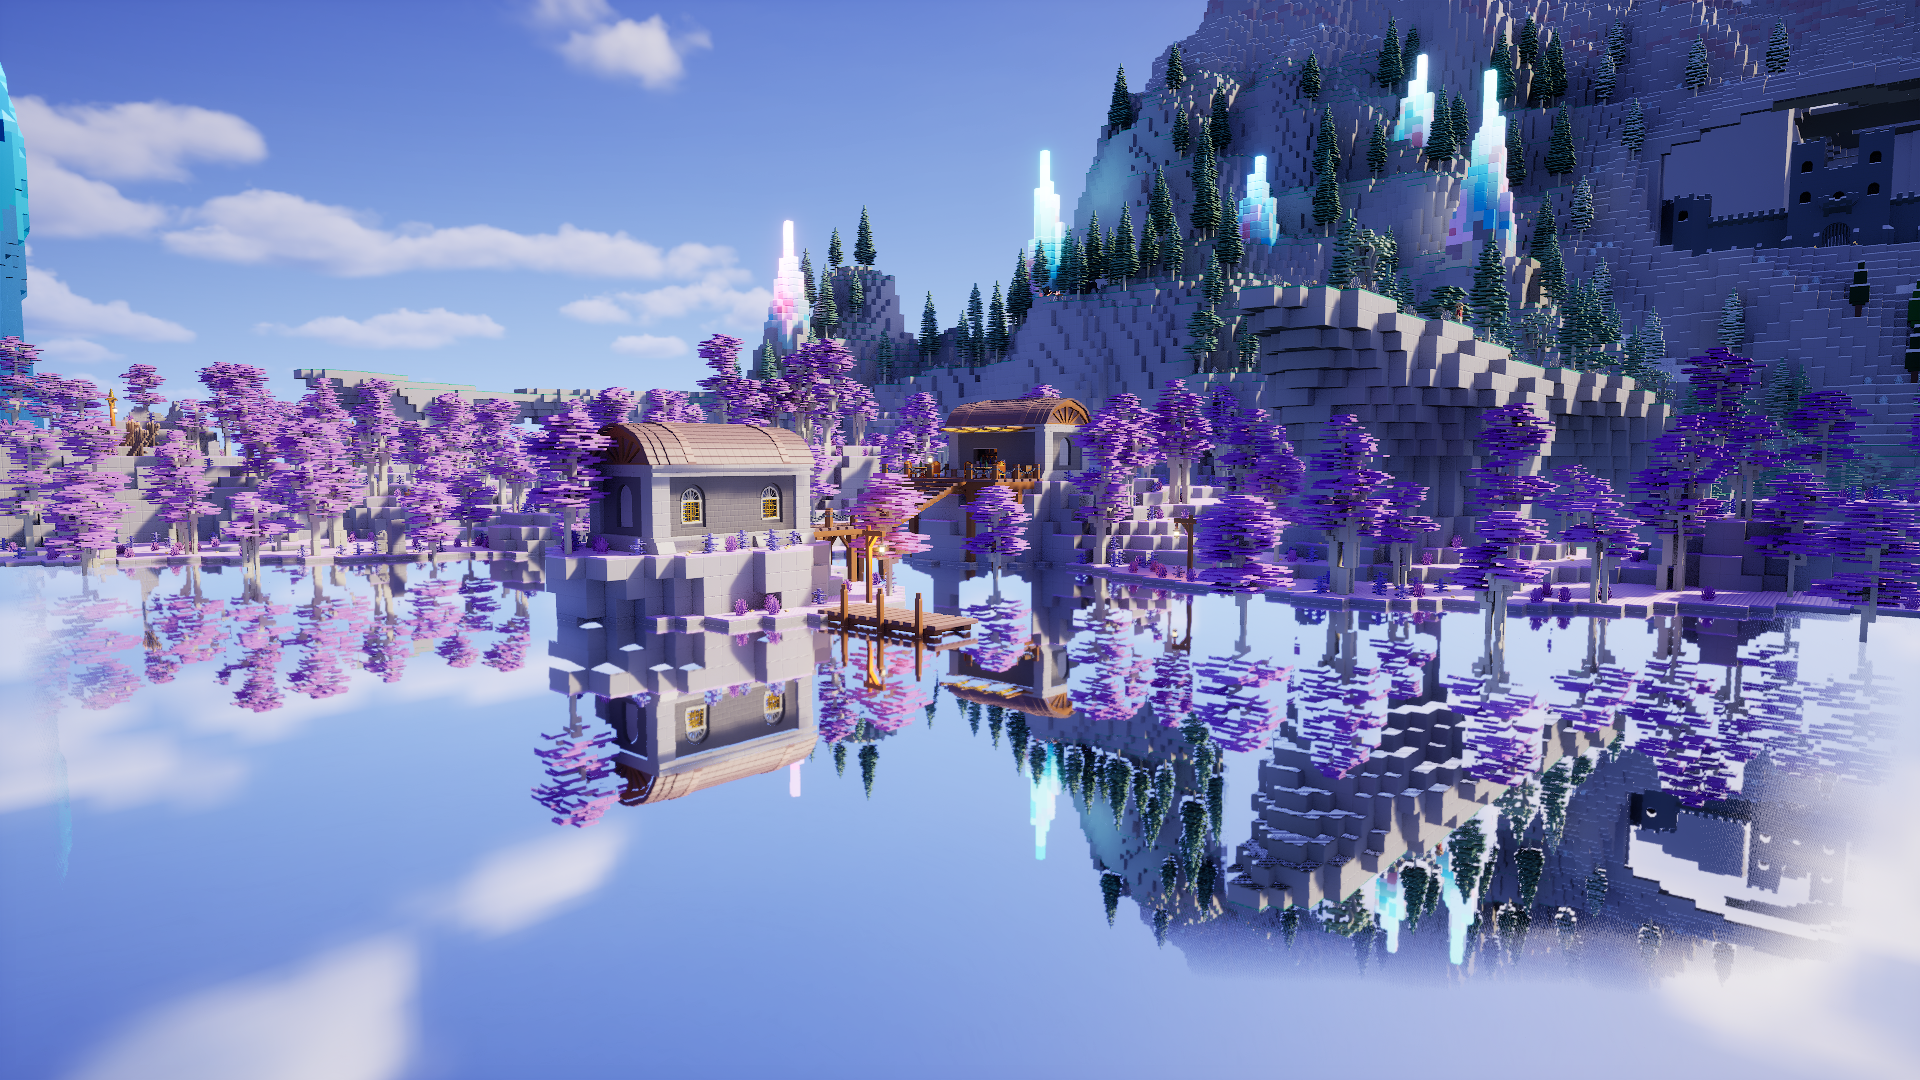
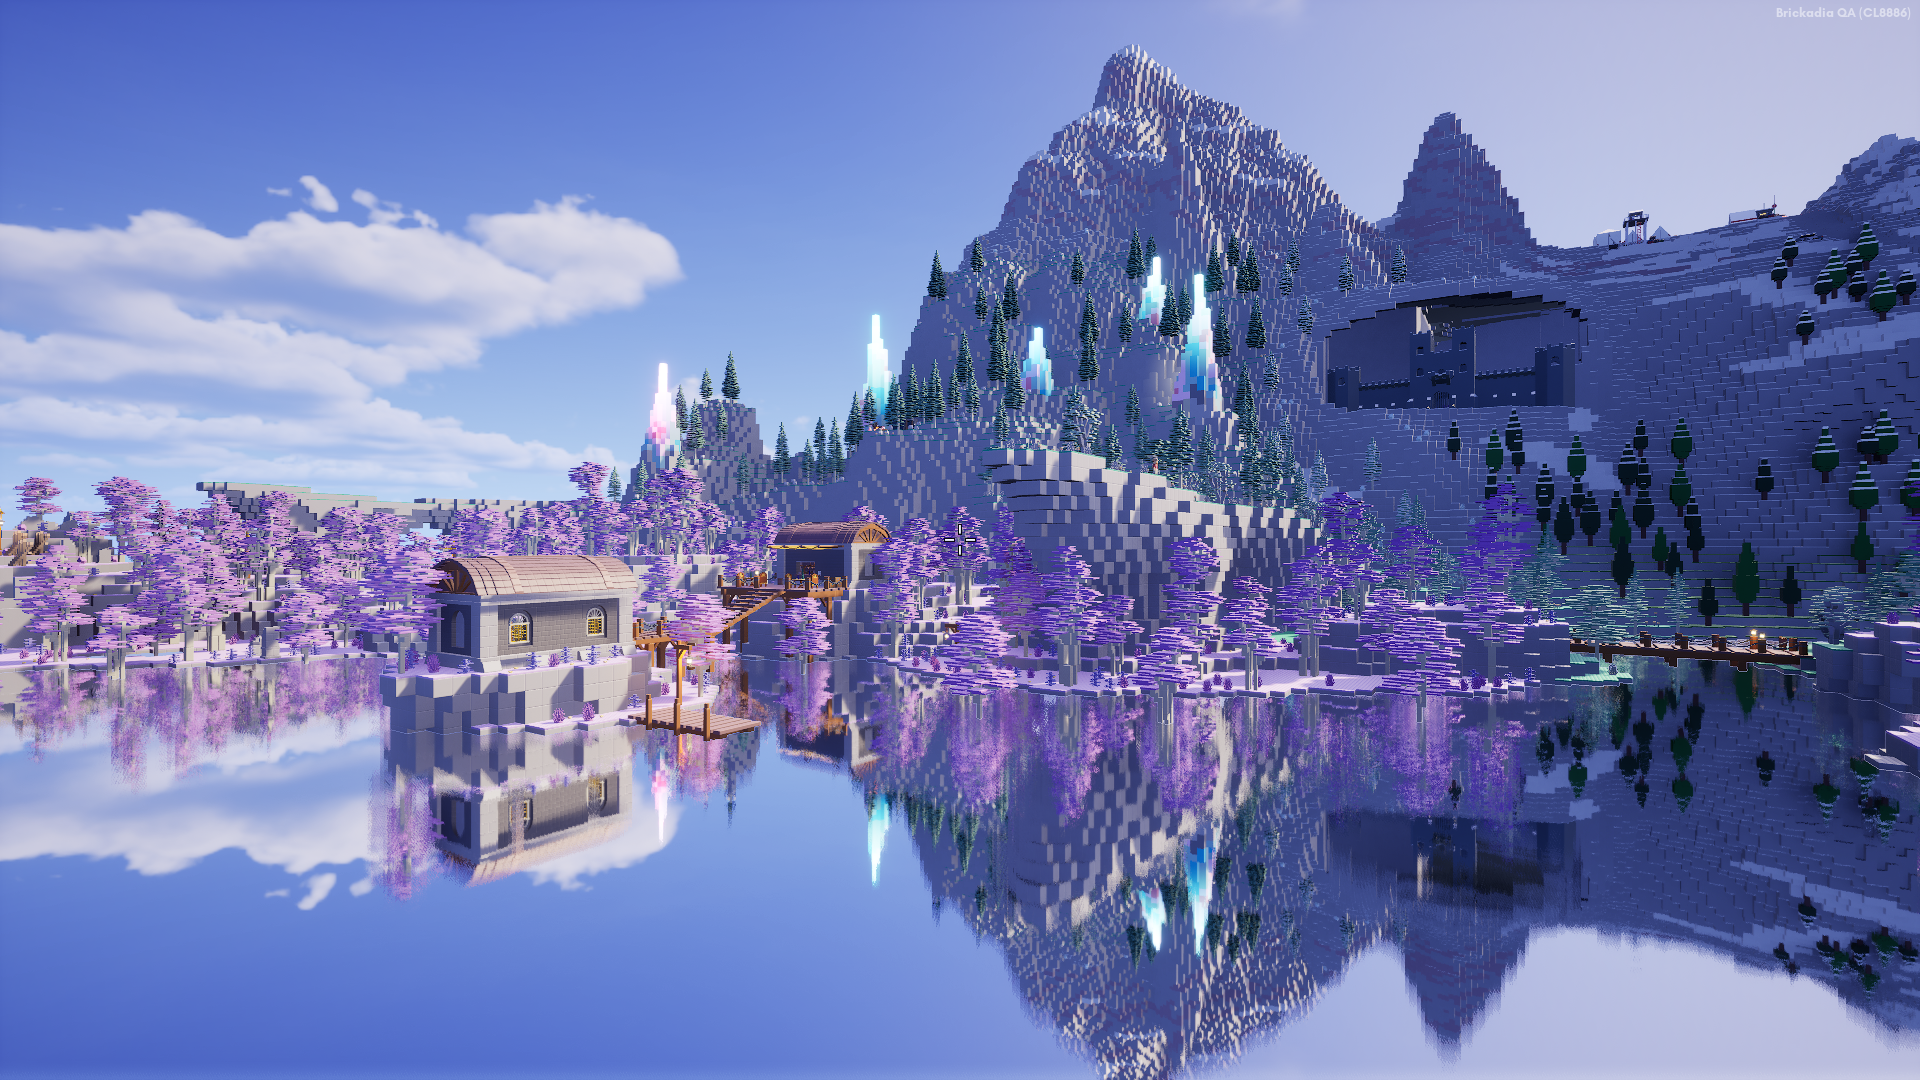
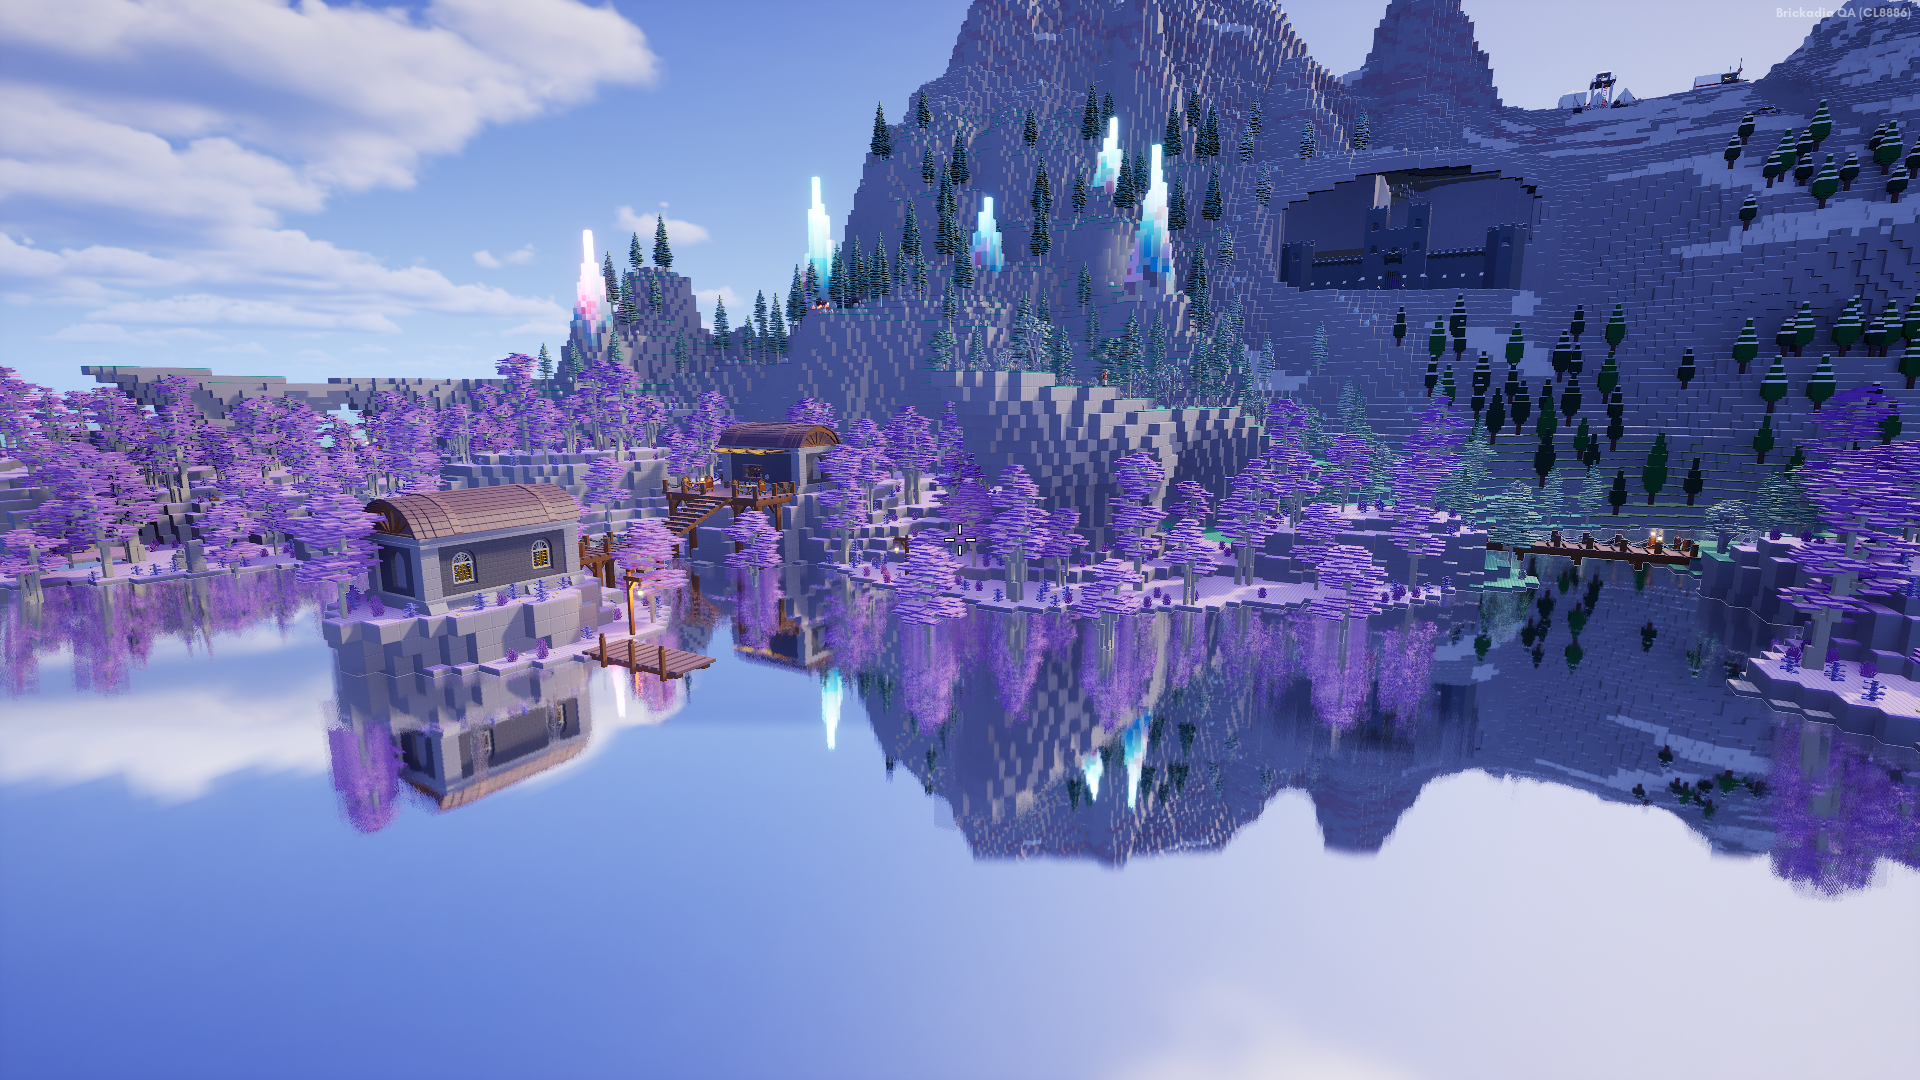
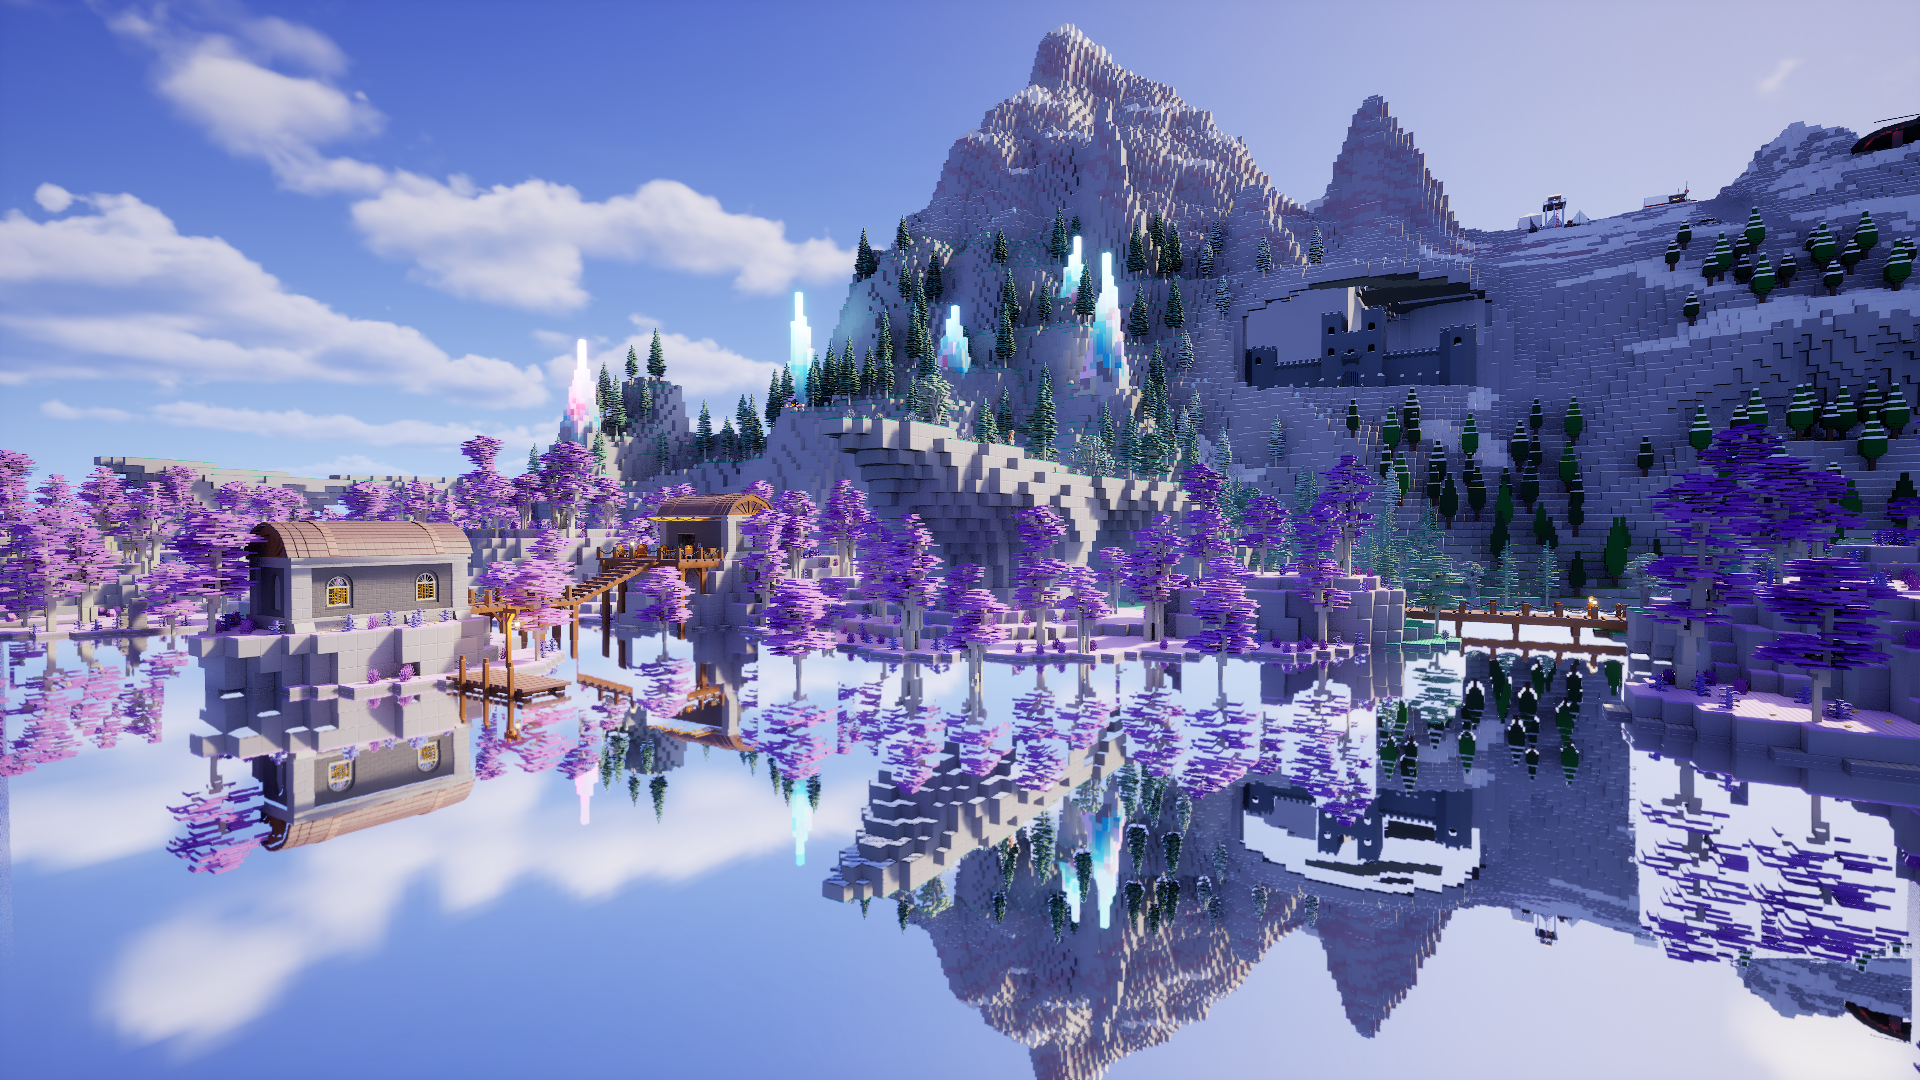
Here are some pictures of environments our testers created!
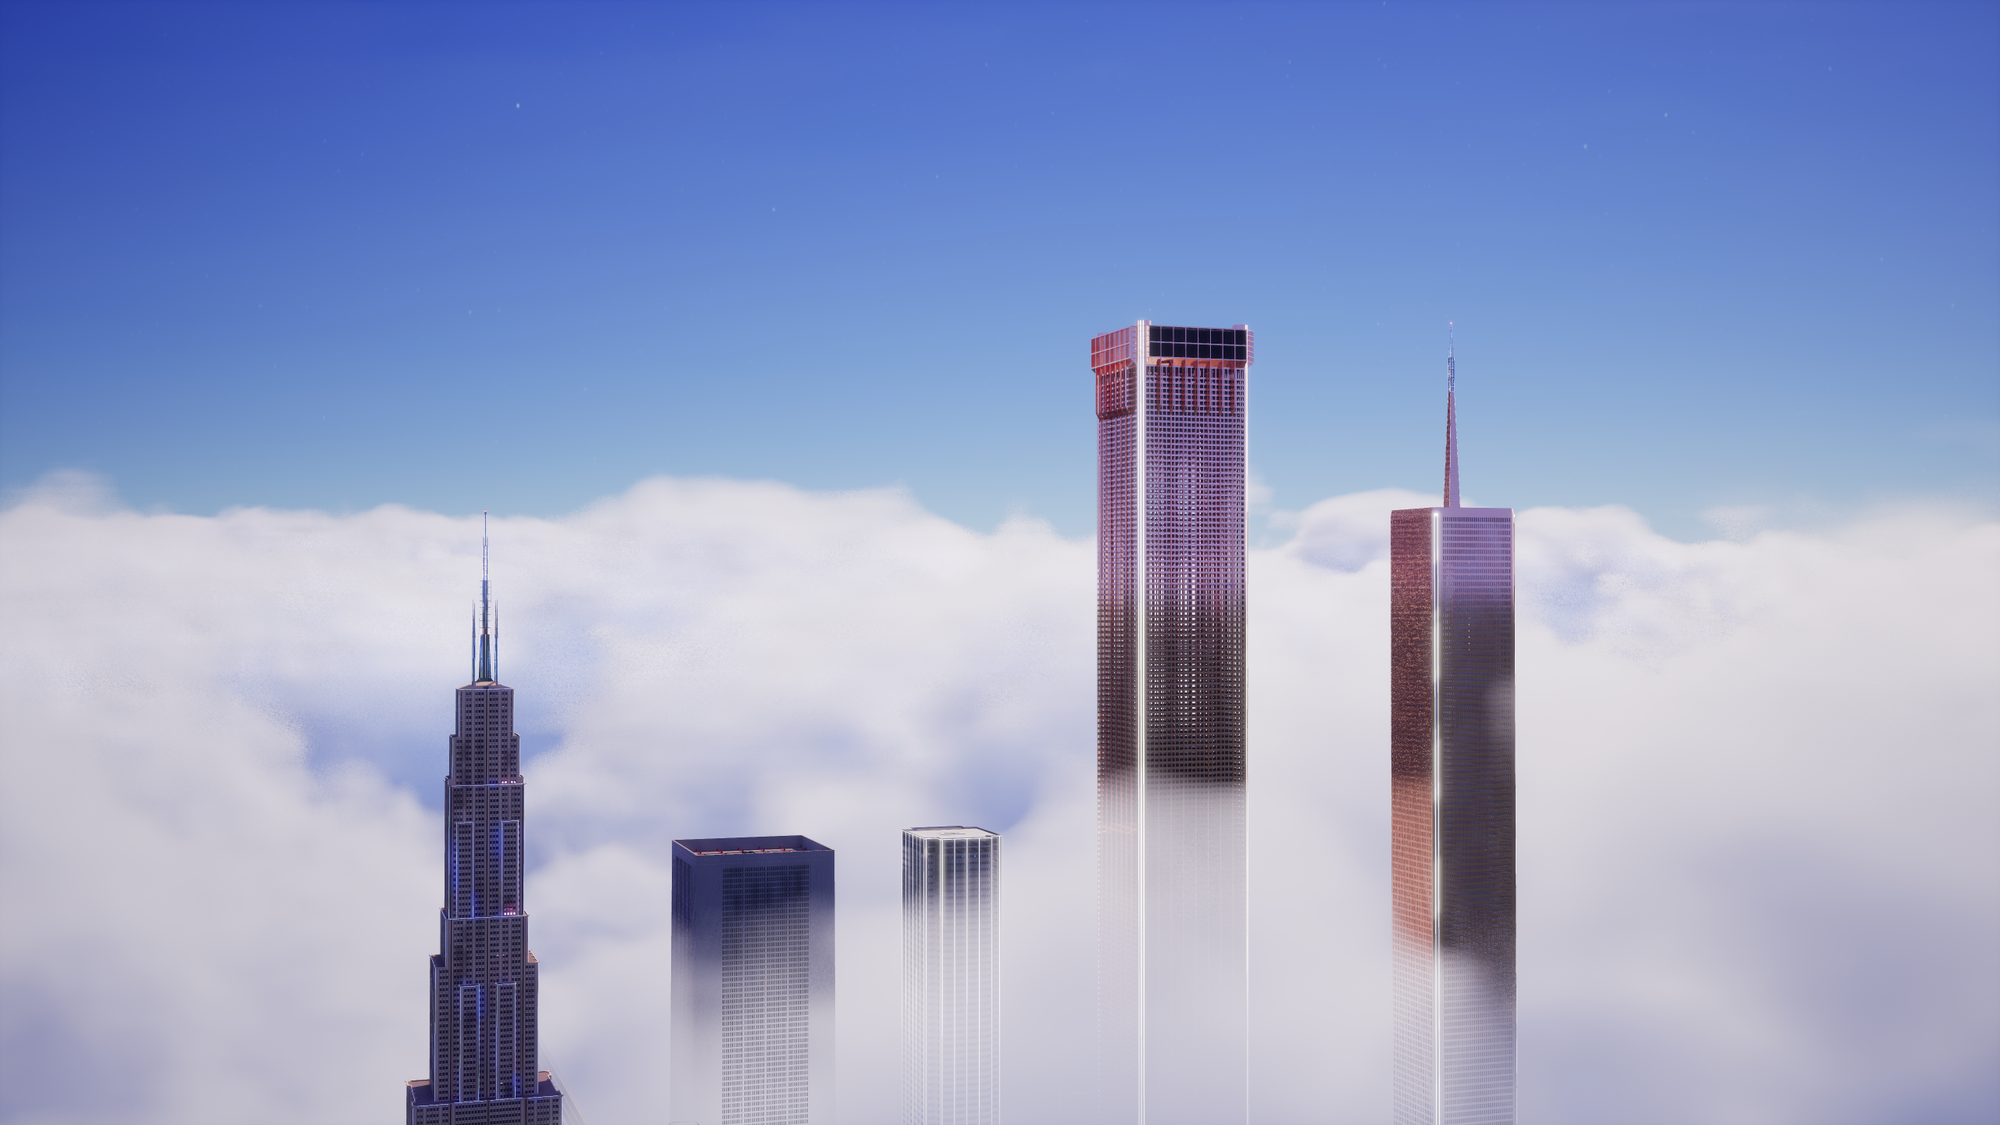
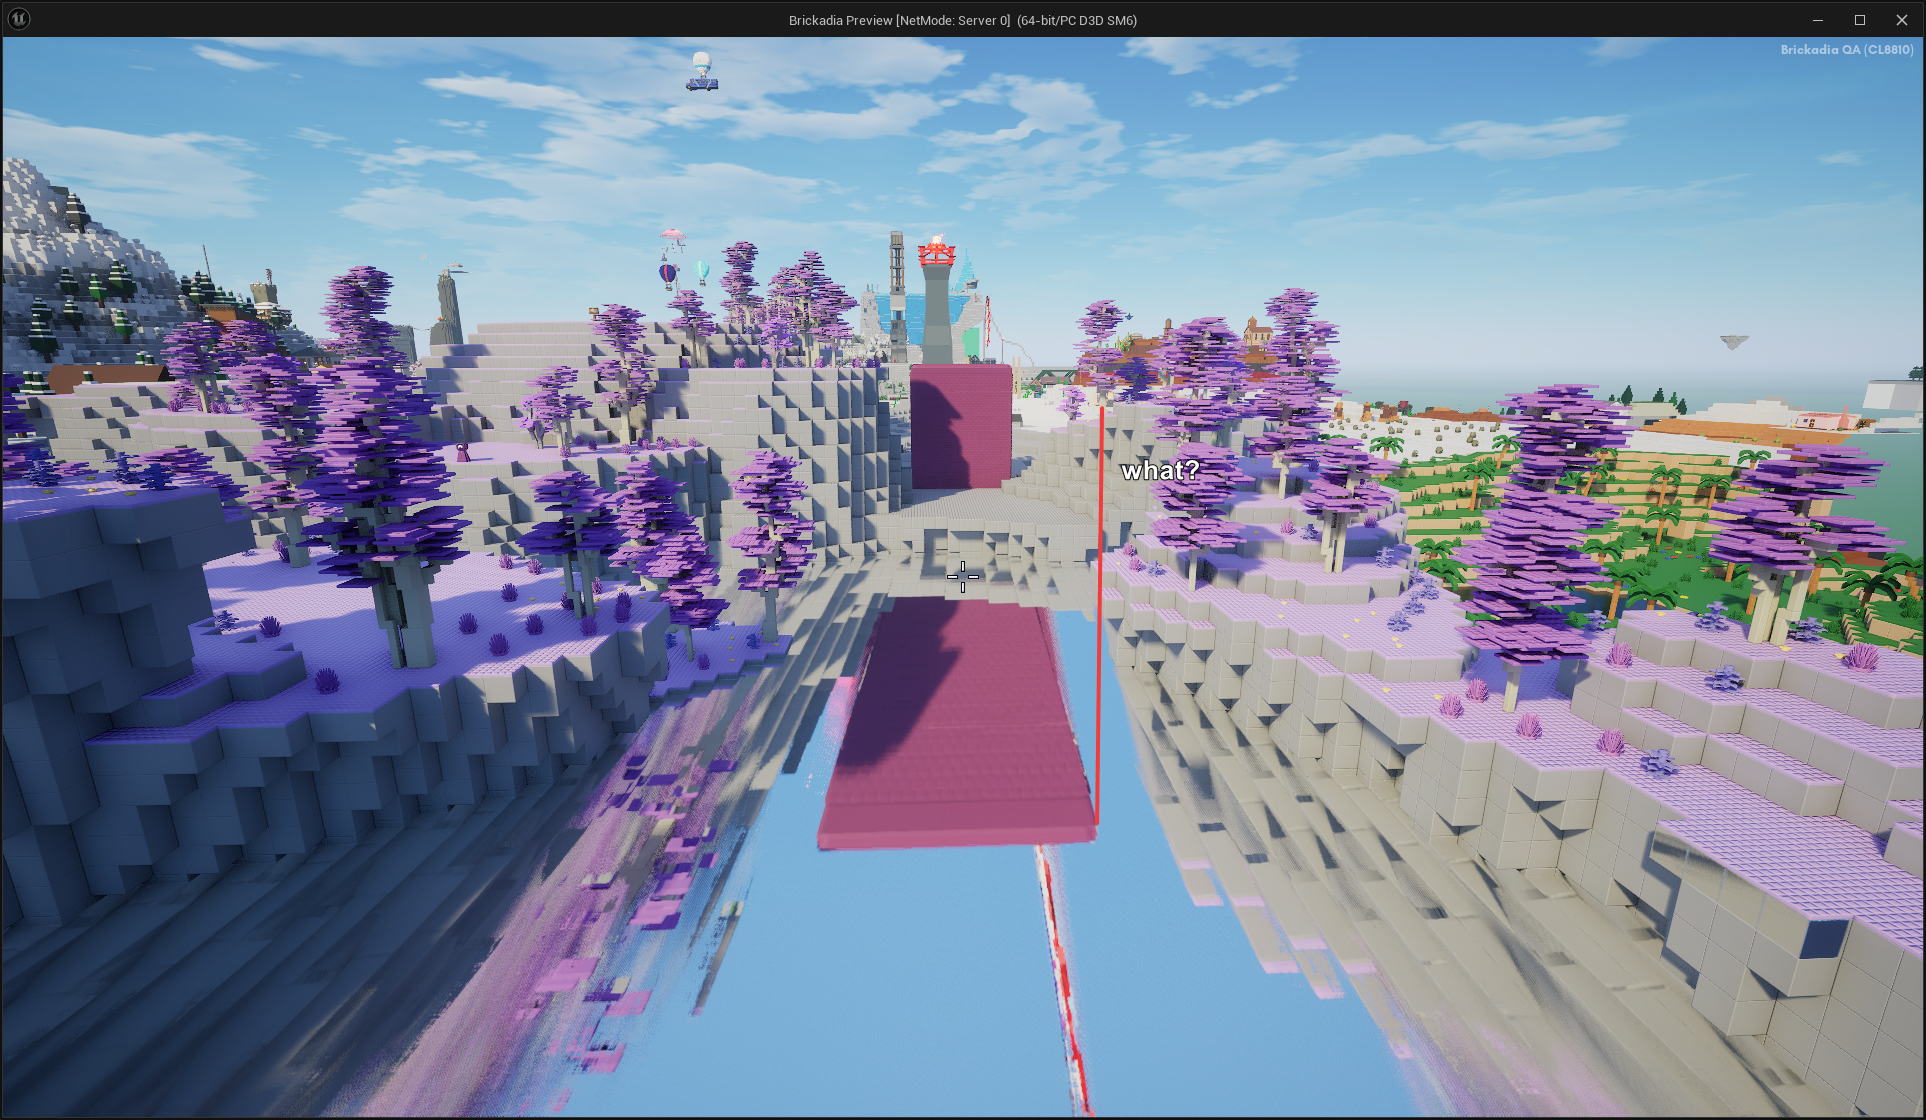
Flat Earth Theory Disproven
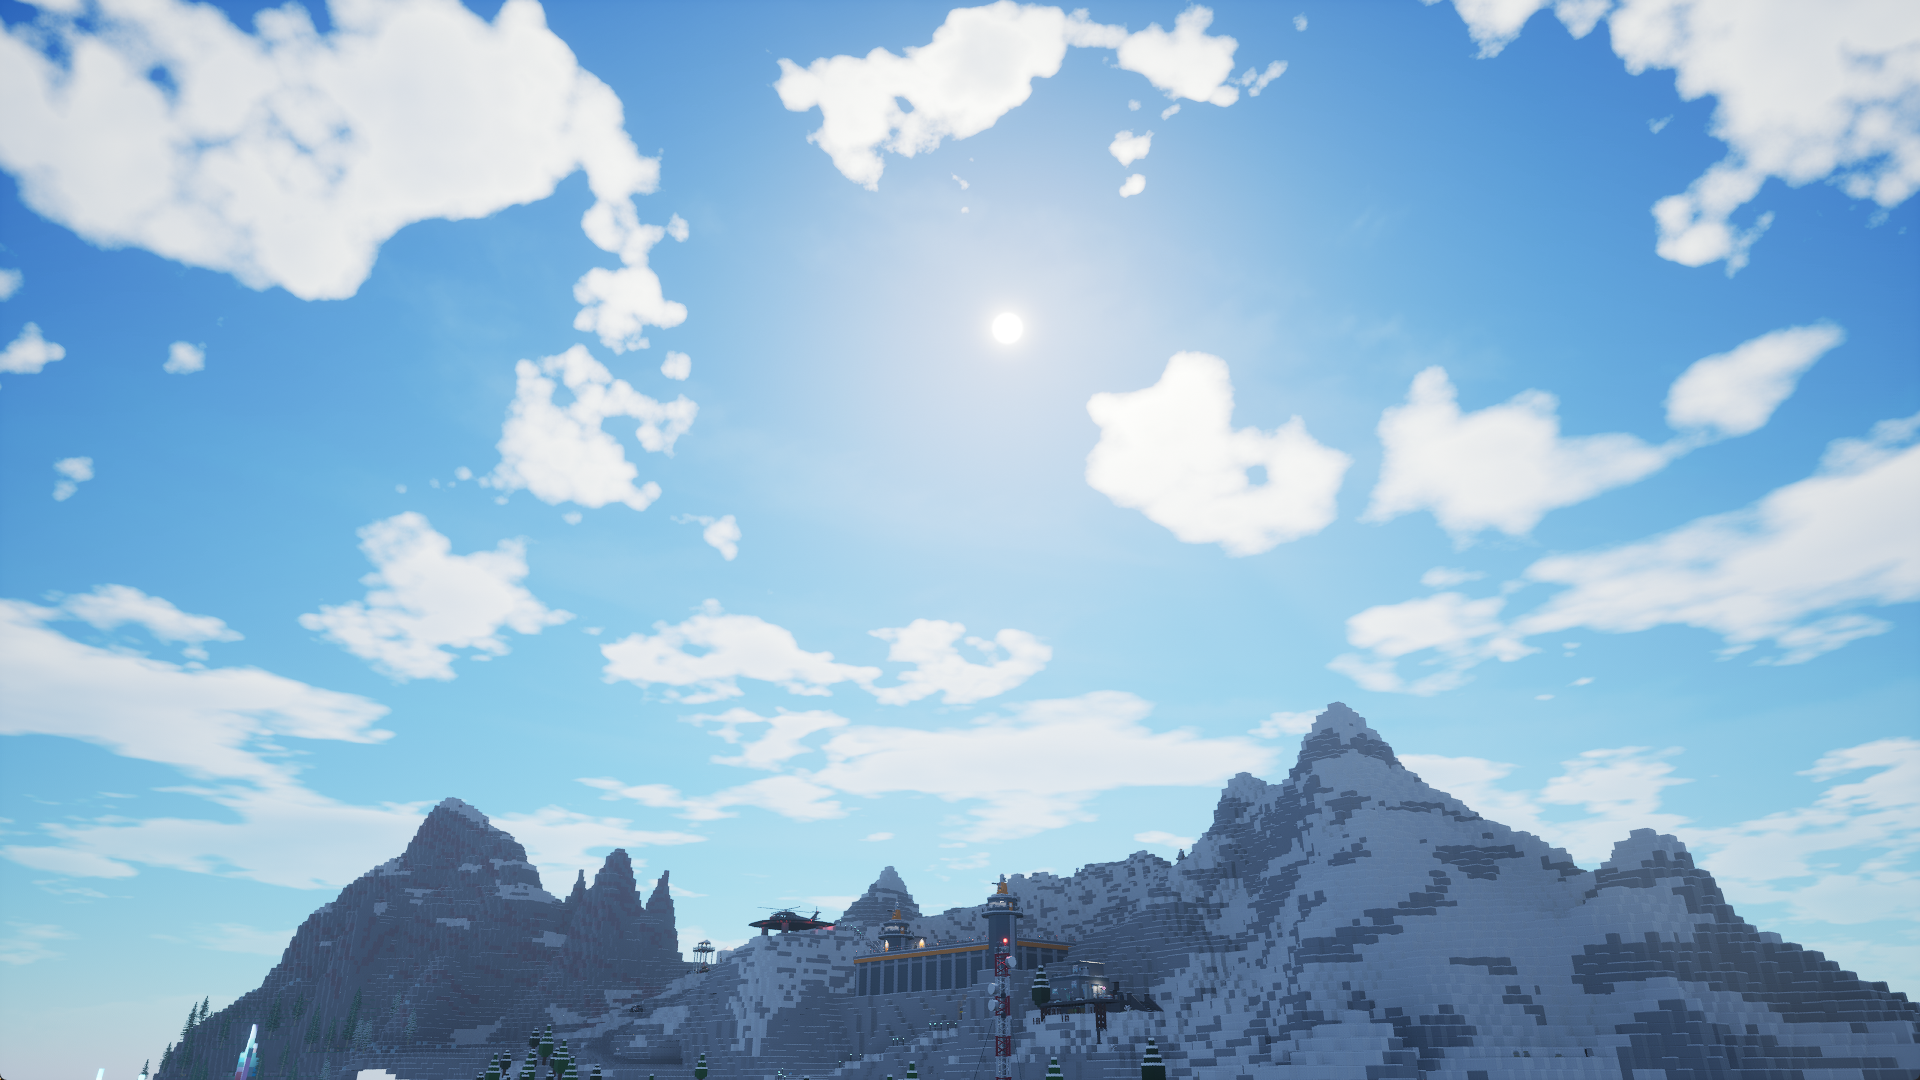
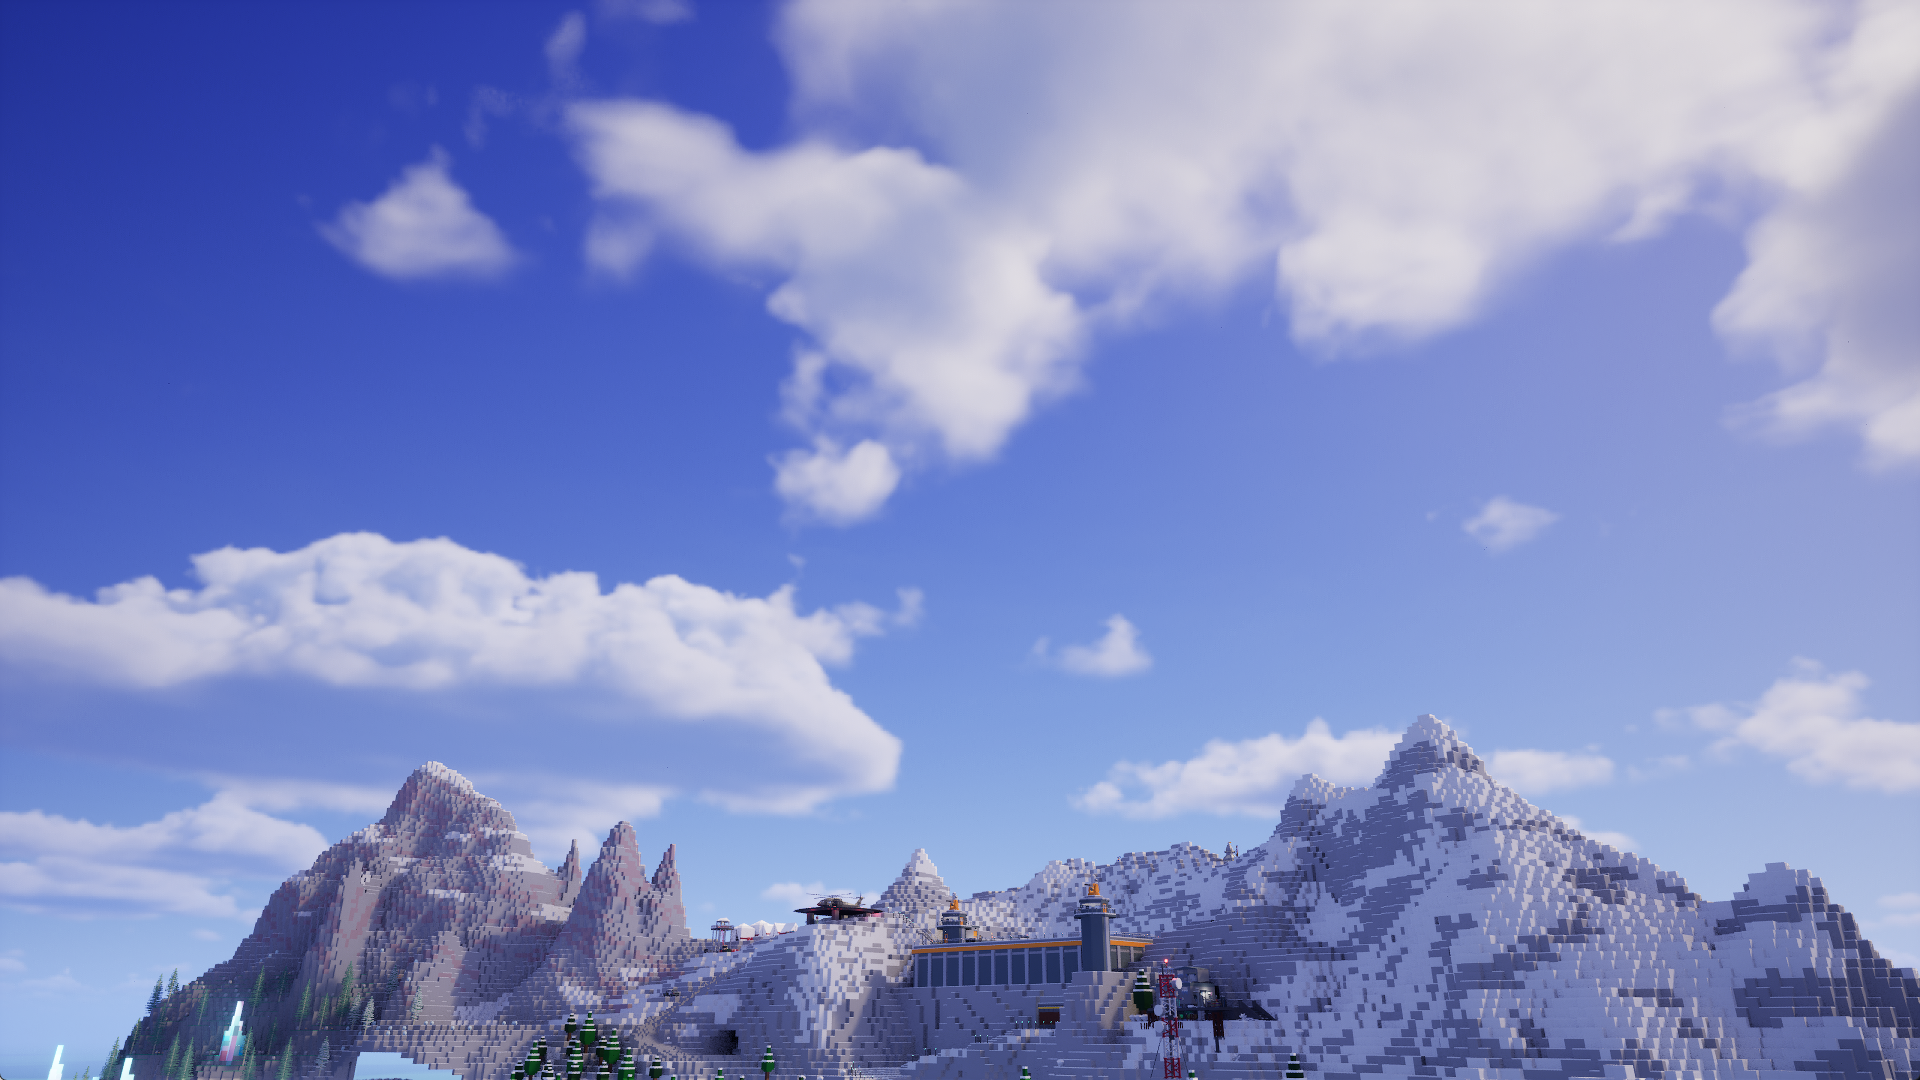
We've finally managed to send a satellite with a camera into outer space, and discovered the ground is in fact not flat.
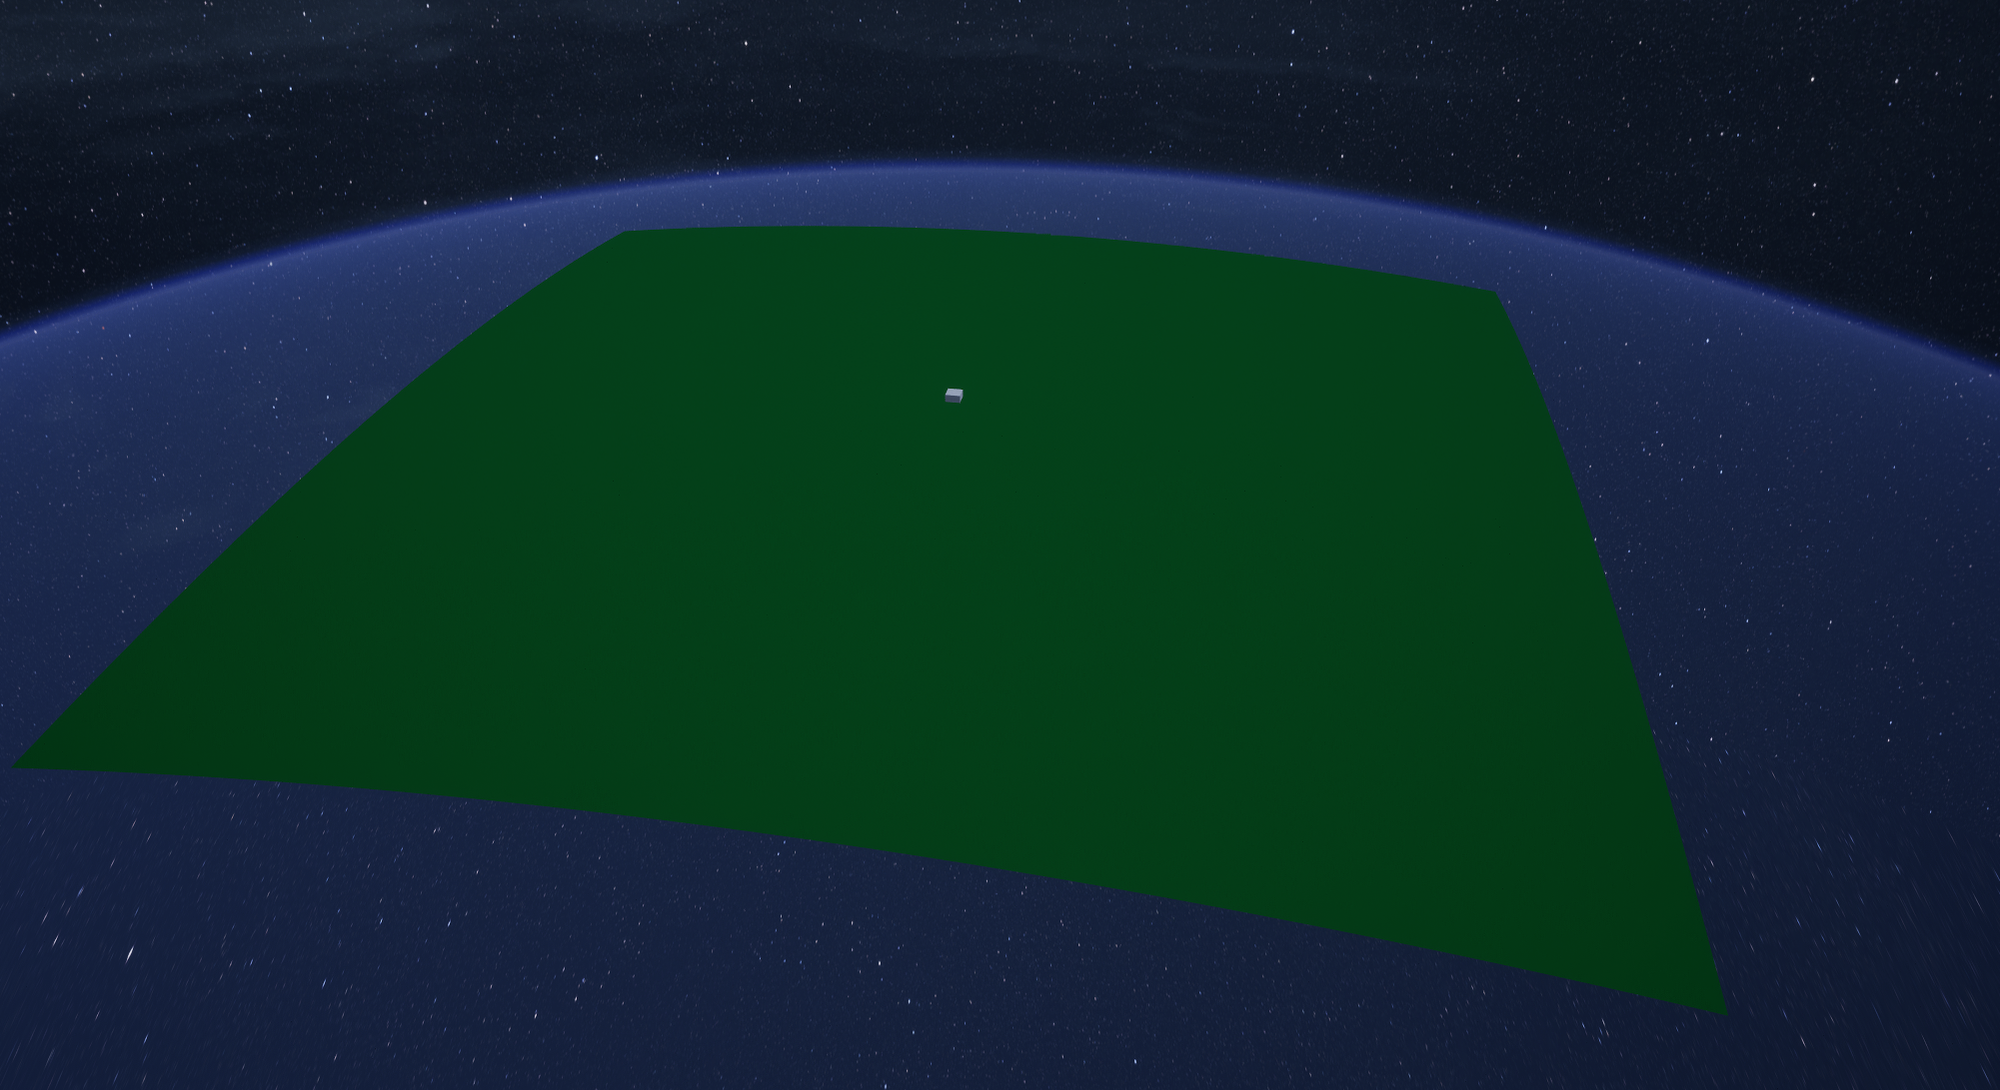
This change had to be made because the sky relies on atmosphere simulation, and atmospheres only exist for round planets. So we curved the entire map. Don't worry, it's imperceptible at ground level, because the playable area is contained in the little white cube. You can see the difference clearly above the clouds:
Improved Screen Space Reflections
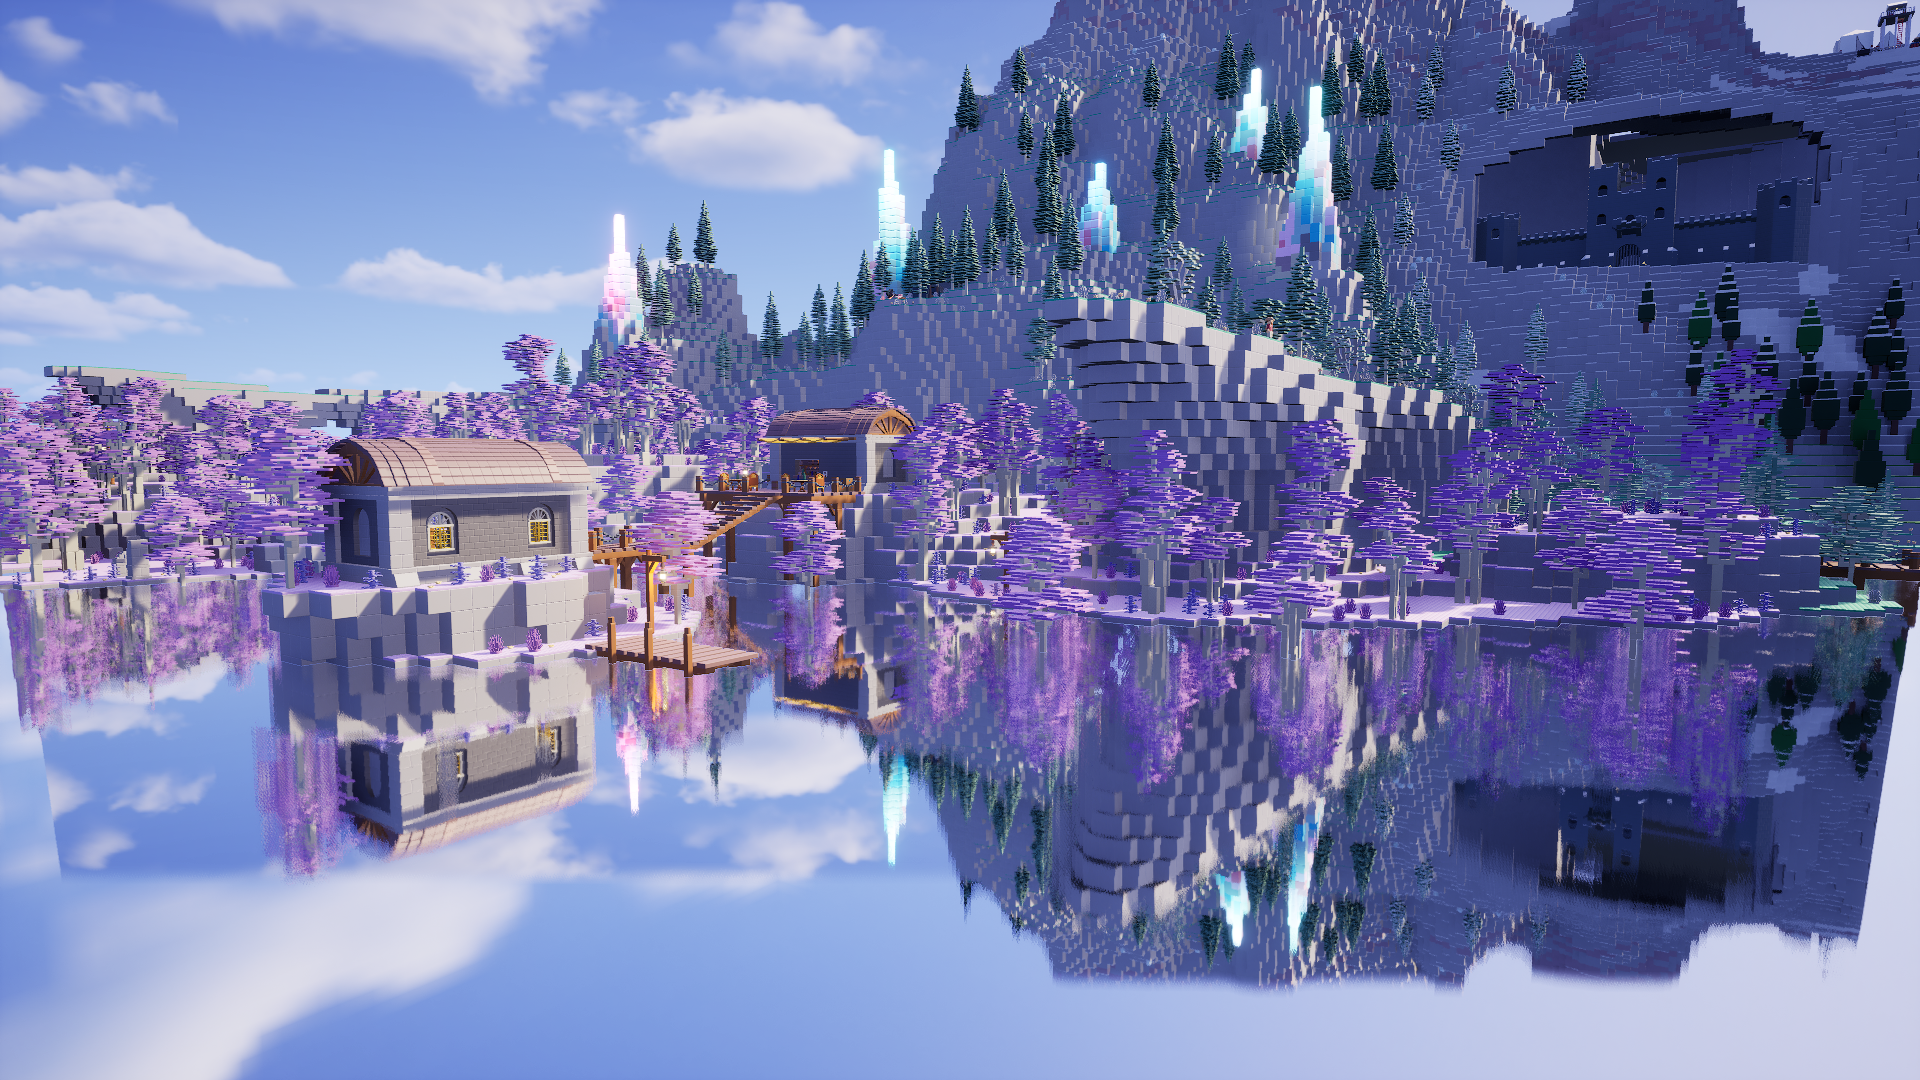
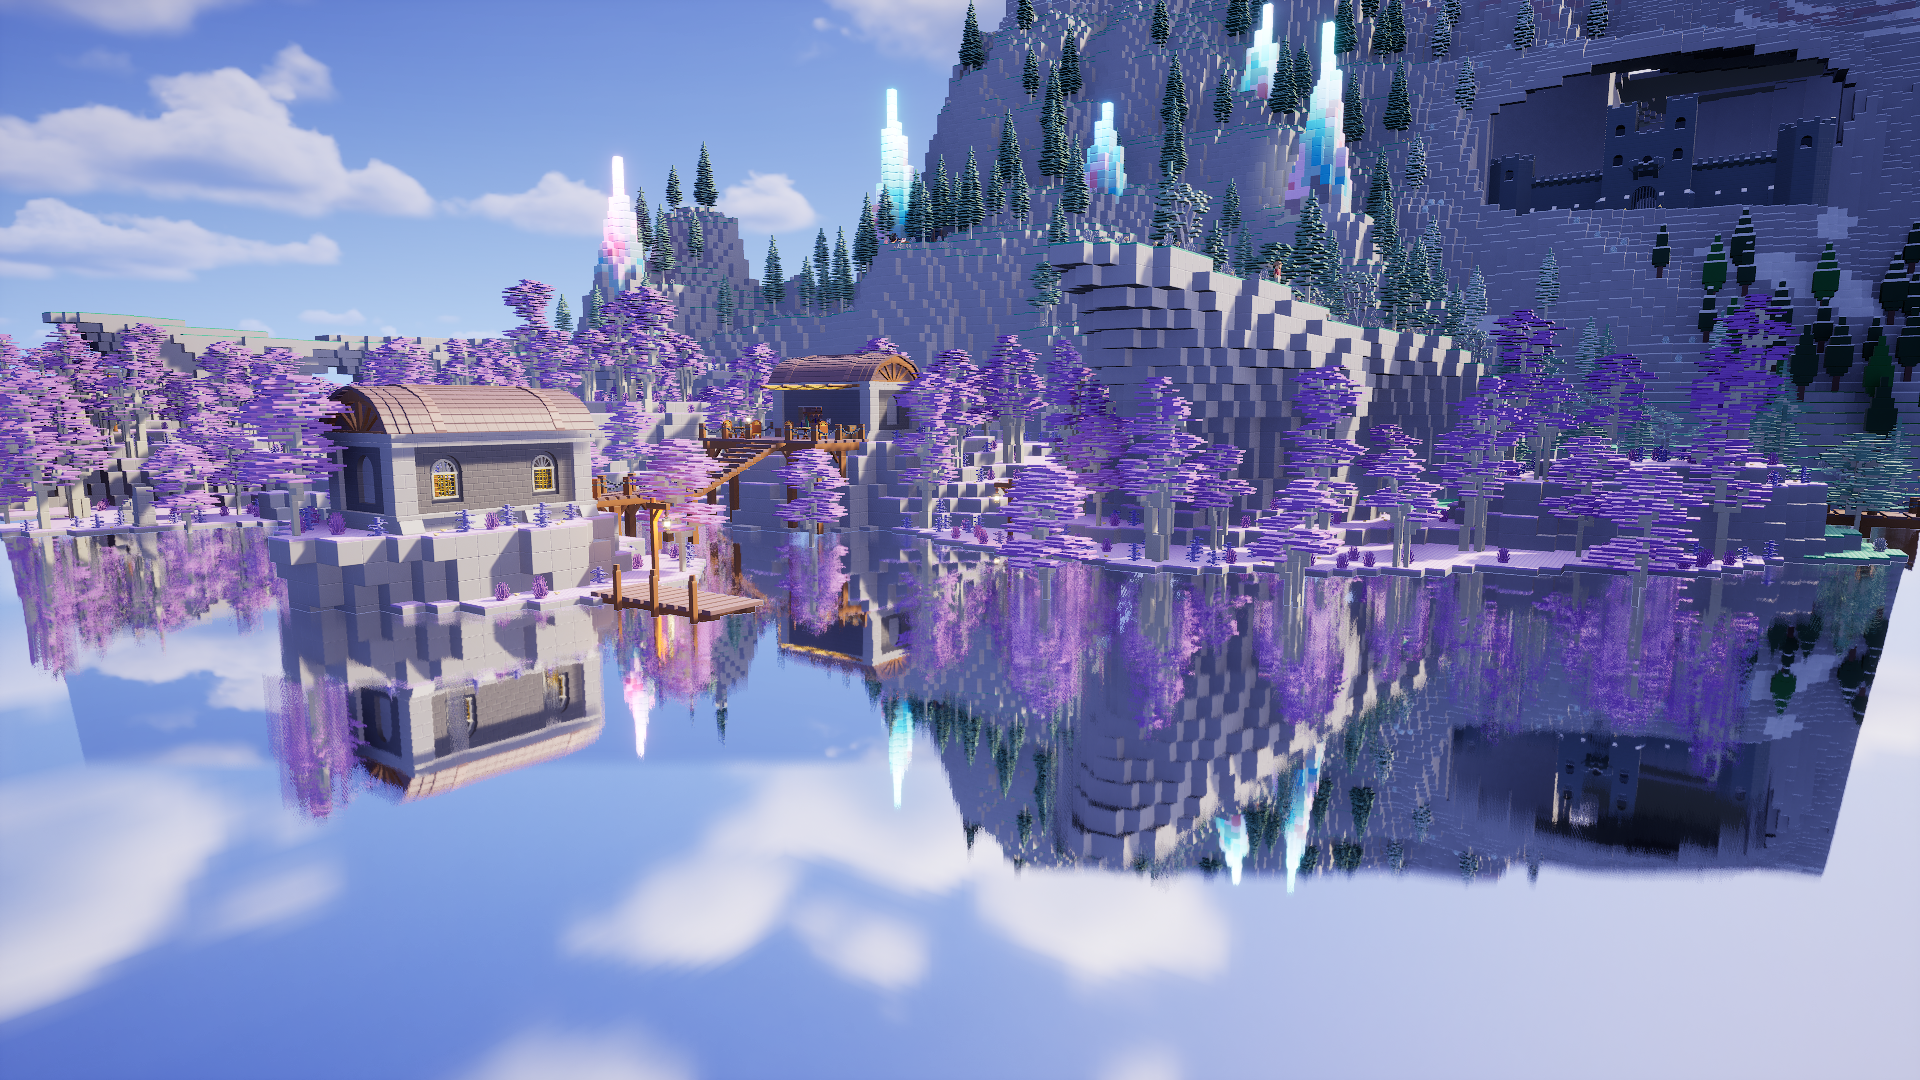
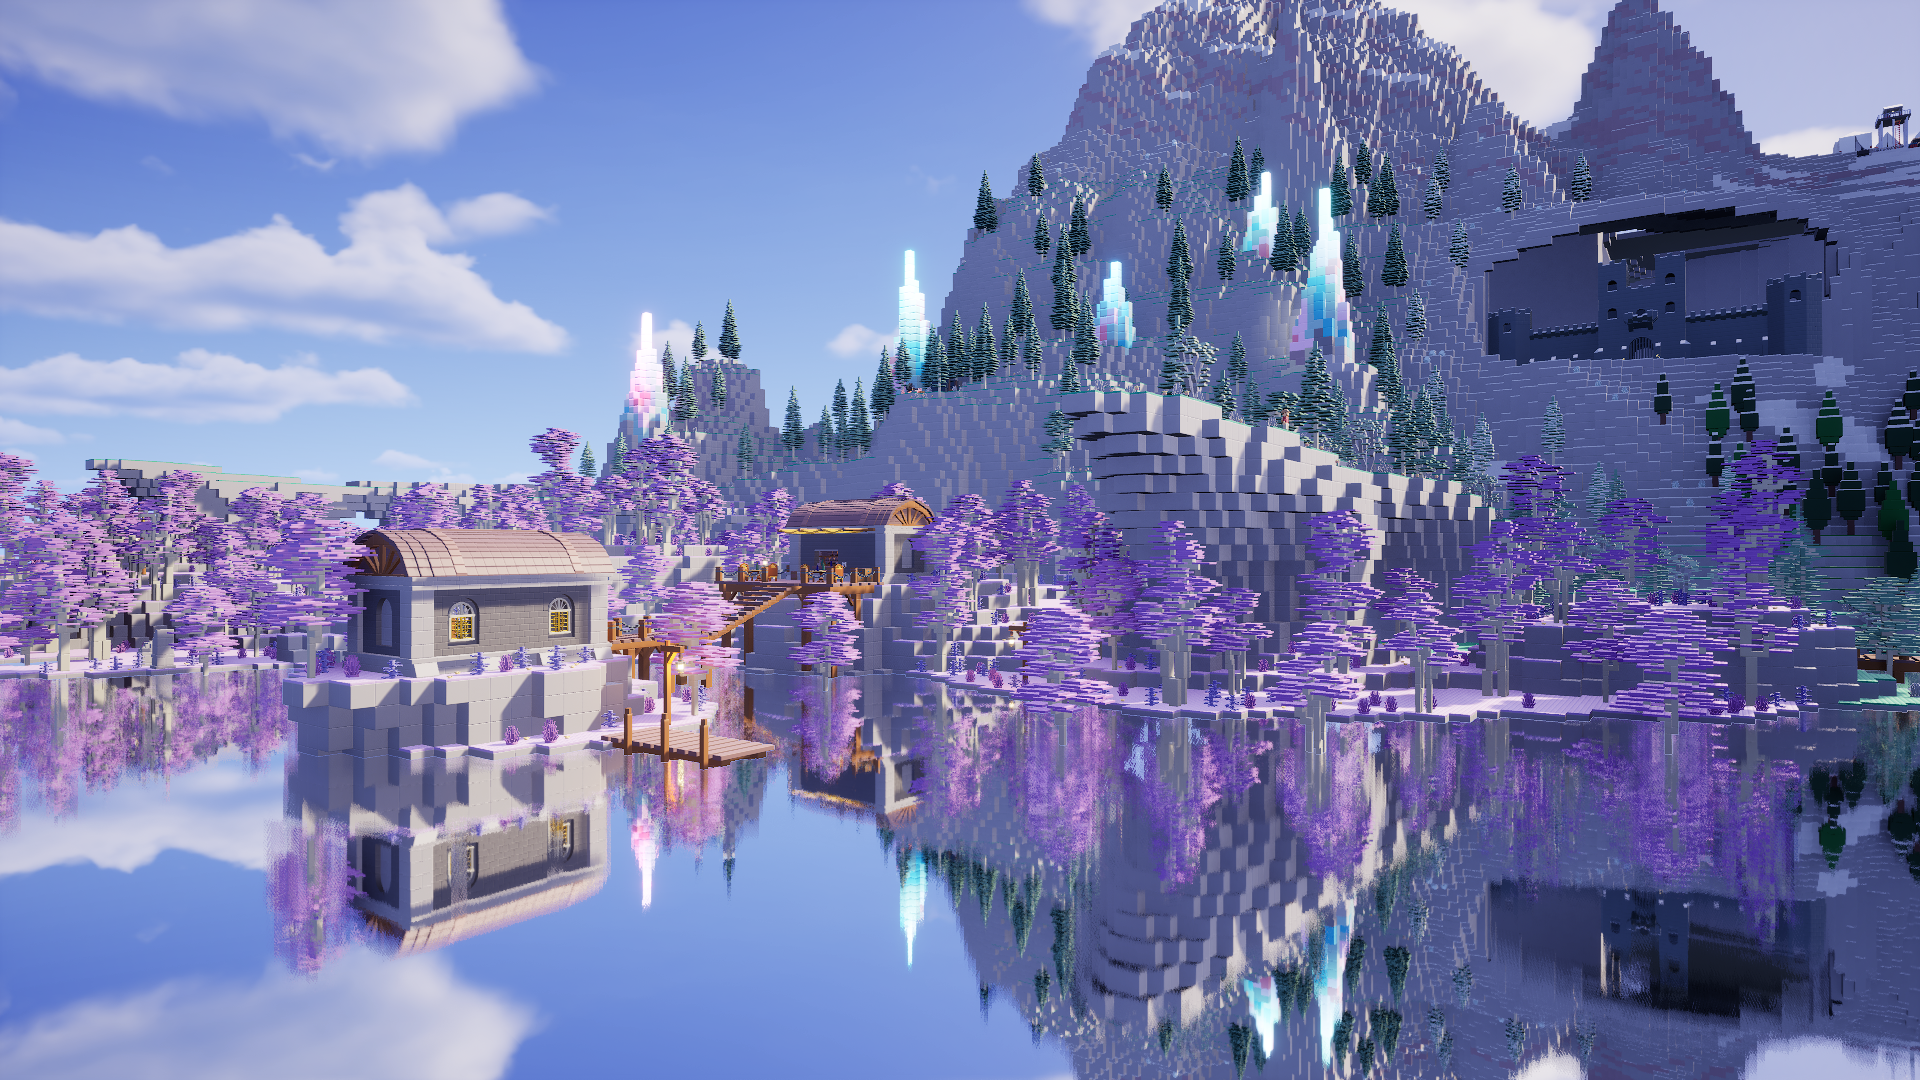
We can currently only use screen space reflections in the game, as our bricks are not yet represented in the off-screen scene data used for Lumen reflections. In most cases, like if you don't look straight at a mirror, this looks good enough to be acceptable. There are a few really bad outliers though, especially with large bodies of reflective water.
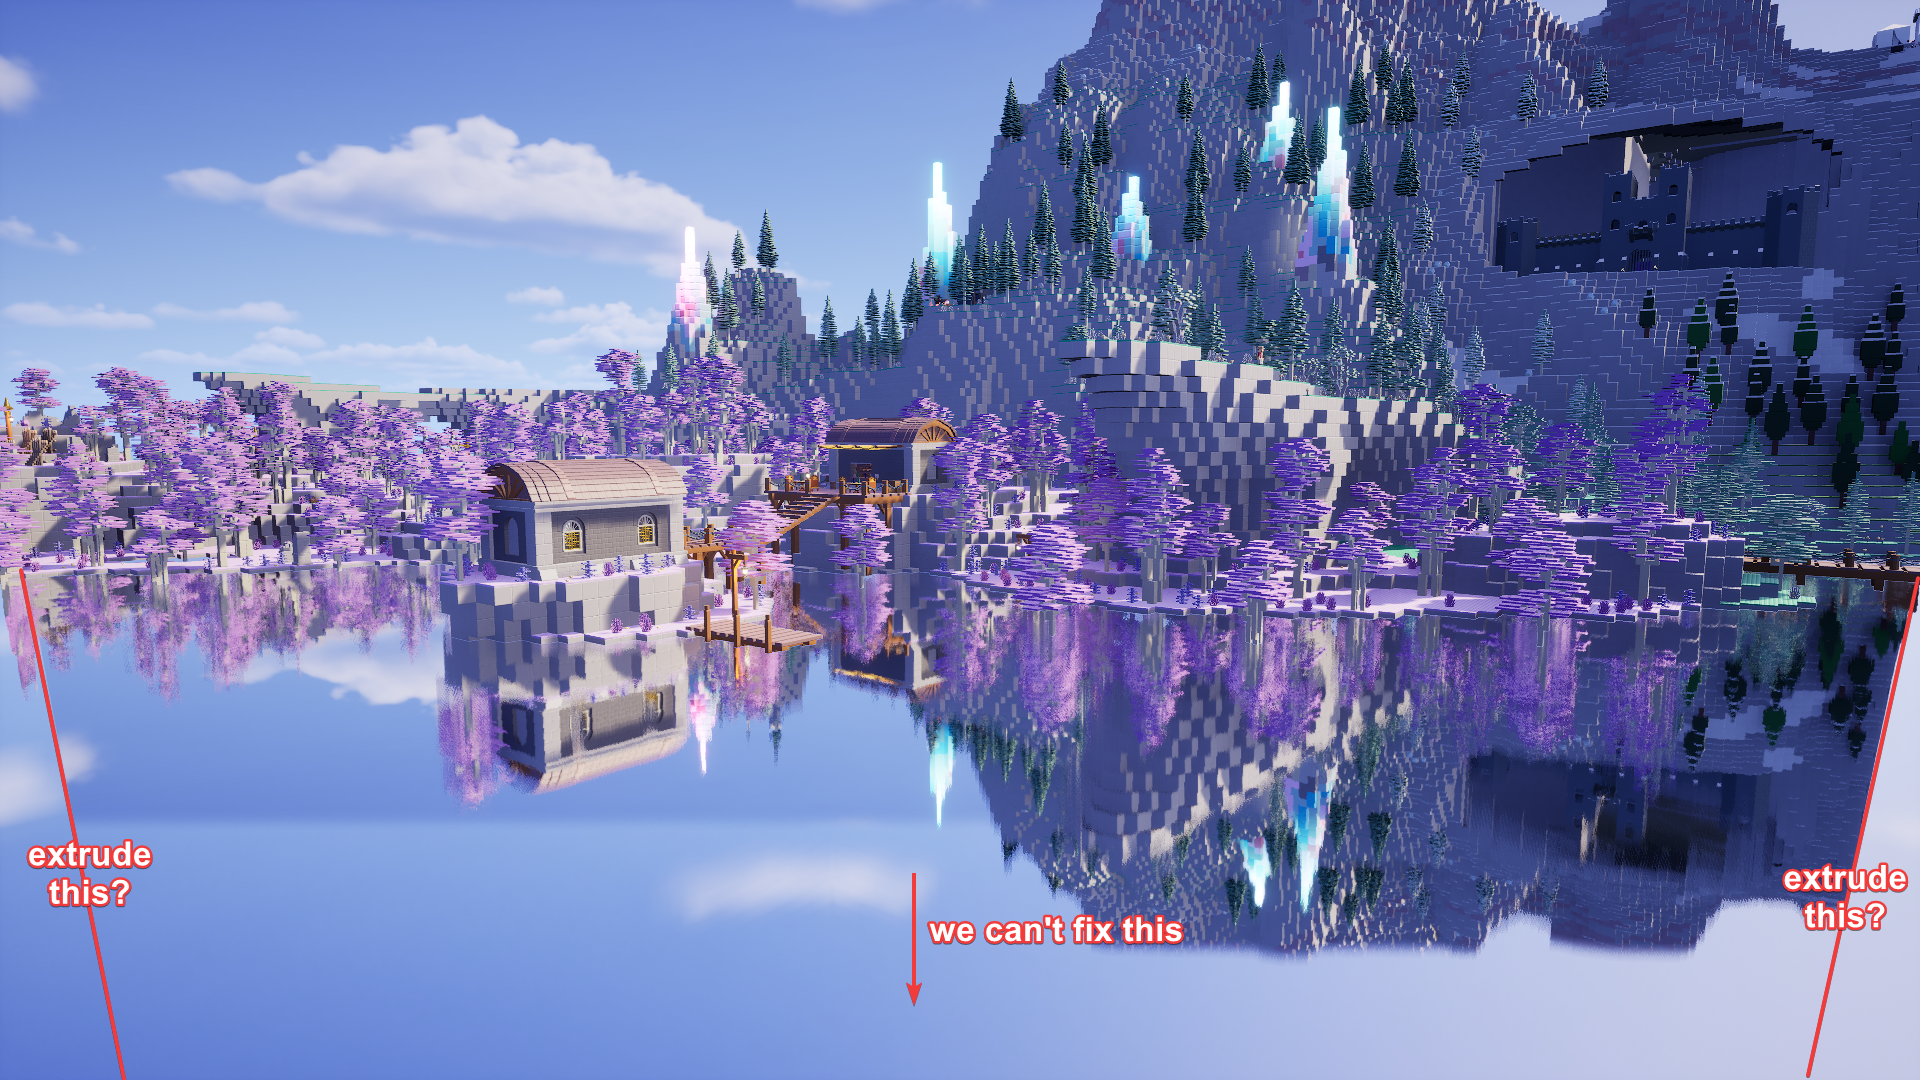
For example, the reflection of the environment on this lake really doesn't look great. It's cut off at the edges of the screen, which looks extremely distracting as you're moving the camera around, because it's always reflecting the sky at full brightness in those corners. Note that I replaced the lake with a perfectly smooth metal surface to make the reflection more easily visible.
And if we enable the Proto-Lumen reflections, we get sharper reflections with even more sky incorrectly visible in them. This is especially visible under the trees. It's because Lumen would normally trace the off-screen scene data there, but we don't have that, and won't at release.
So I decided to fix, or at least, bodge this until we can eventually use "proper" Lumen. Let's attack the white edges on the left and right side first. What is actually the problem there?
Bending Water Reflection Rays
To understand the problem at the screen edges, we have to be aware of how screen space reflections work at least on a high level. It's actually a fairly simple concept. The engine first renders the game world without reflections, then for each pixel where a reflective surface (like a lake) is visible, it calculates where the reflection would be located, and tries to retrieve the color at that location from the rendered image.
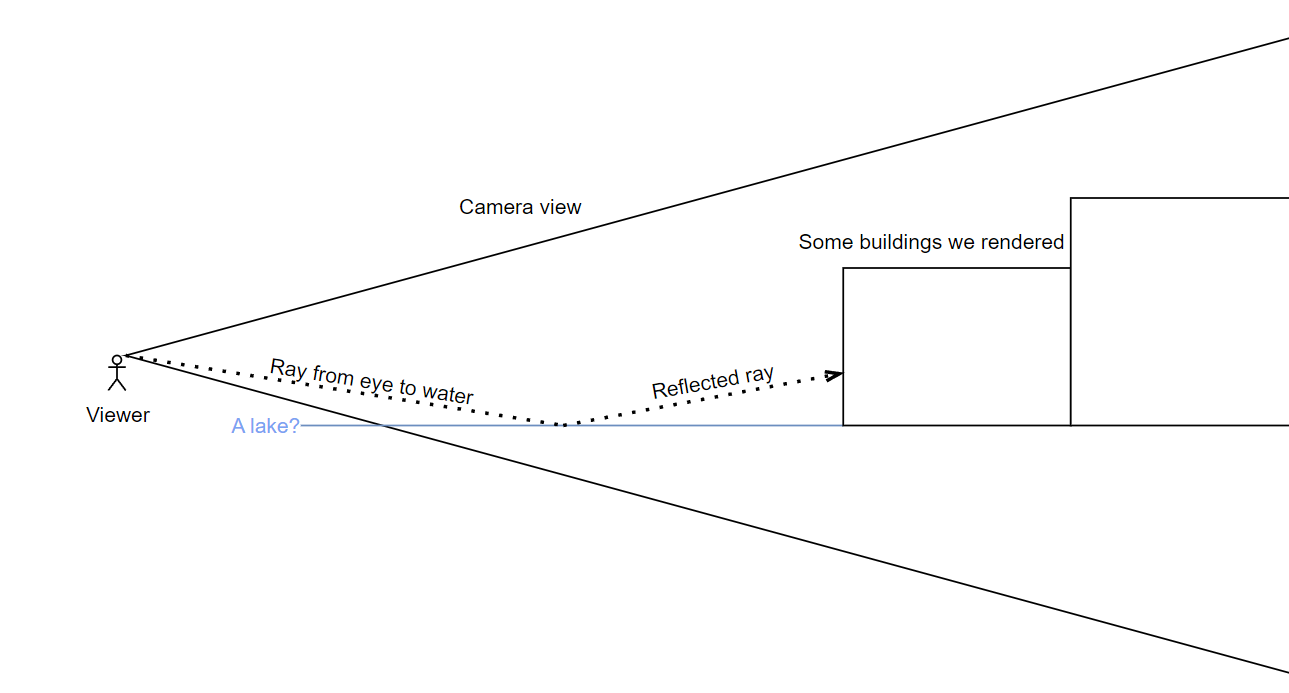
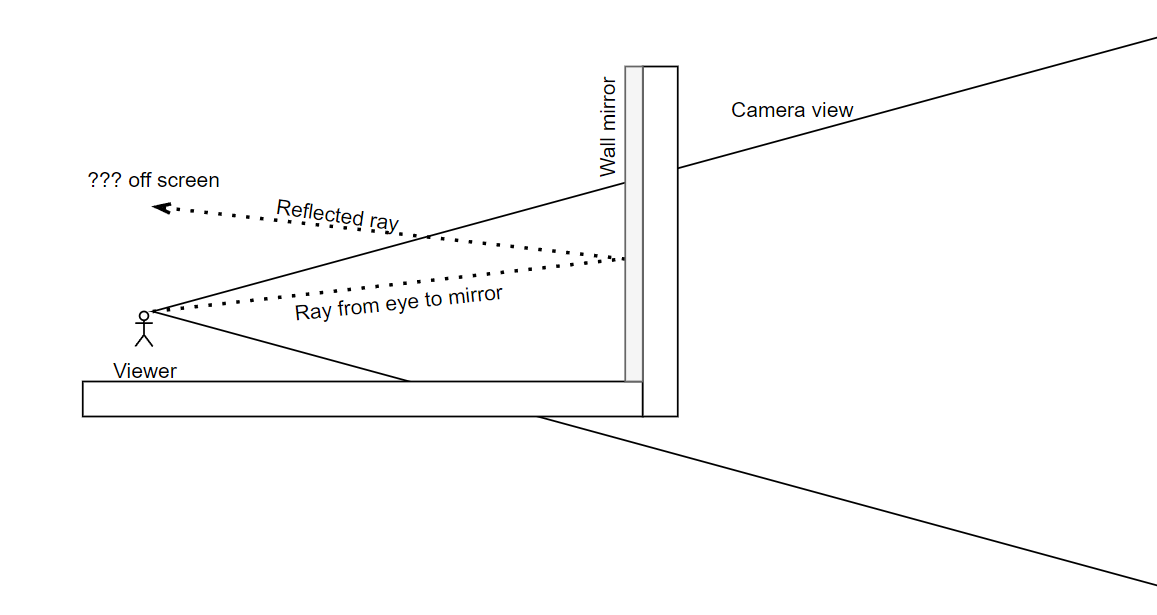
So according to that simple drawing we should be able to see buildings on screen reflected in the water. But then, what's the issue at the screen edges?
Part of it is actually an intentional fade towards the edges in the shader, to hide artifacts. Let's start by turning that off so we can see what's really going on.
Now we can see the issue more clearly. There's a straight cut where the reflection reaches the edge of what is visible on screen above. The further we look down, the worse it gets, due to the way perspective works.
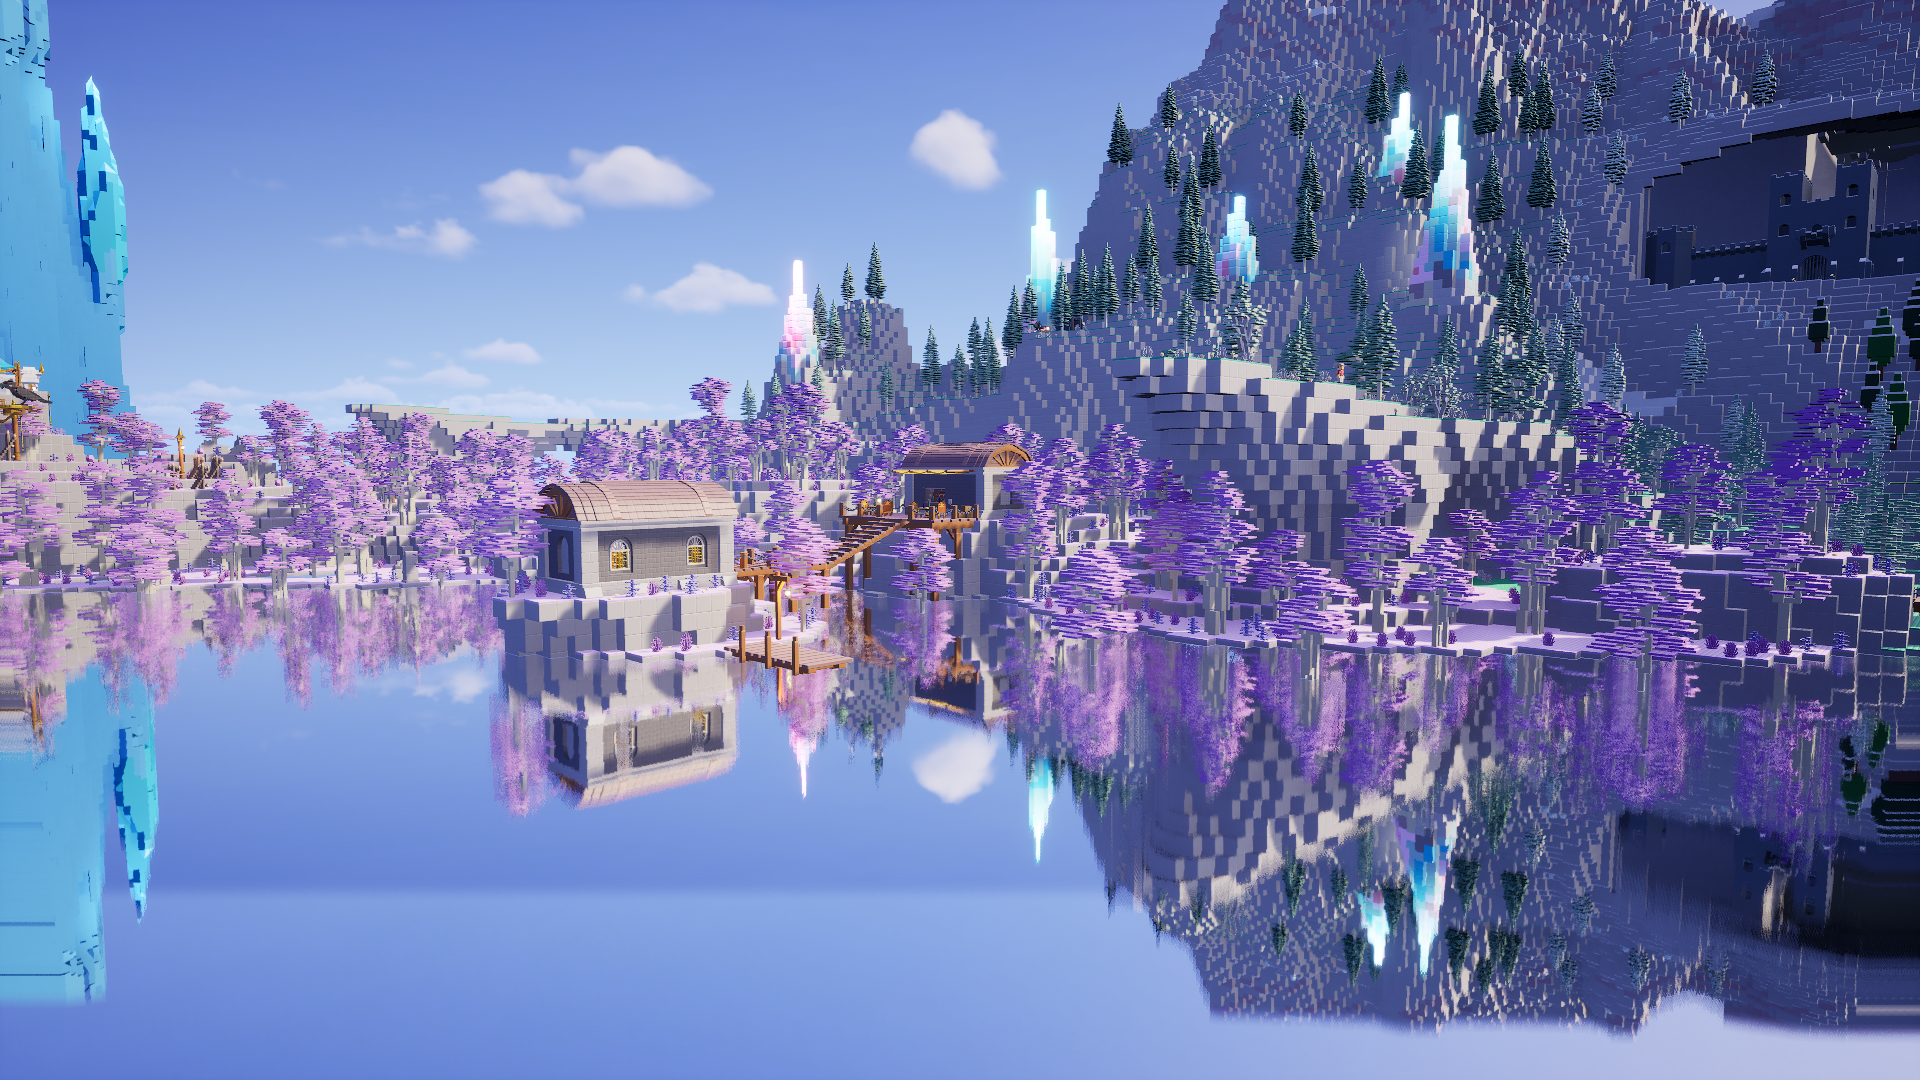
Meanwhile, if we look straight ahead or up, it actually looks fine at the edges, as the reflected area is now smaller than the area we have rendered on screen.
My initial try to fix this was to take the reflections we have, and extrude the outer edges to the edge of the screen. So it'd just continue whatever color there is to the actual edge.
I implemented this by clipping the screen space search at the edges of the screen, rather than shortening the ray to remain within the screen. It even looked somewhat reasonable in a still image!
There's a problem though. It looks absolutely terrible in motion! Due to the extrusion effect, large swathes of pixels are changing their color together as we turn the camera, so this isn't any less distracting than the sky-colored borders.
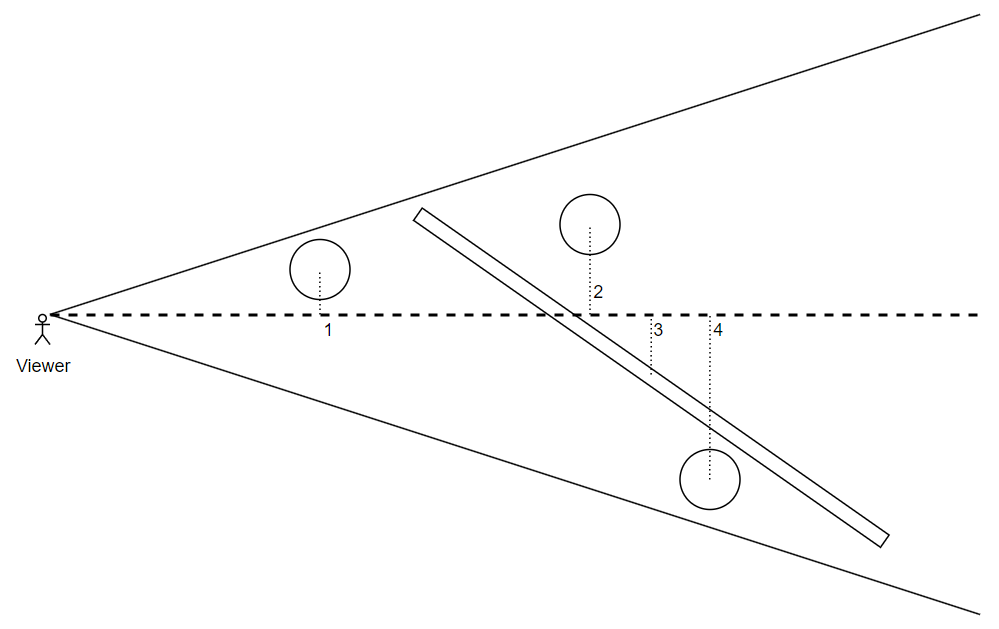
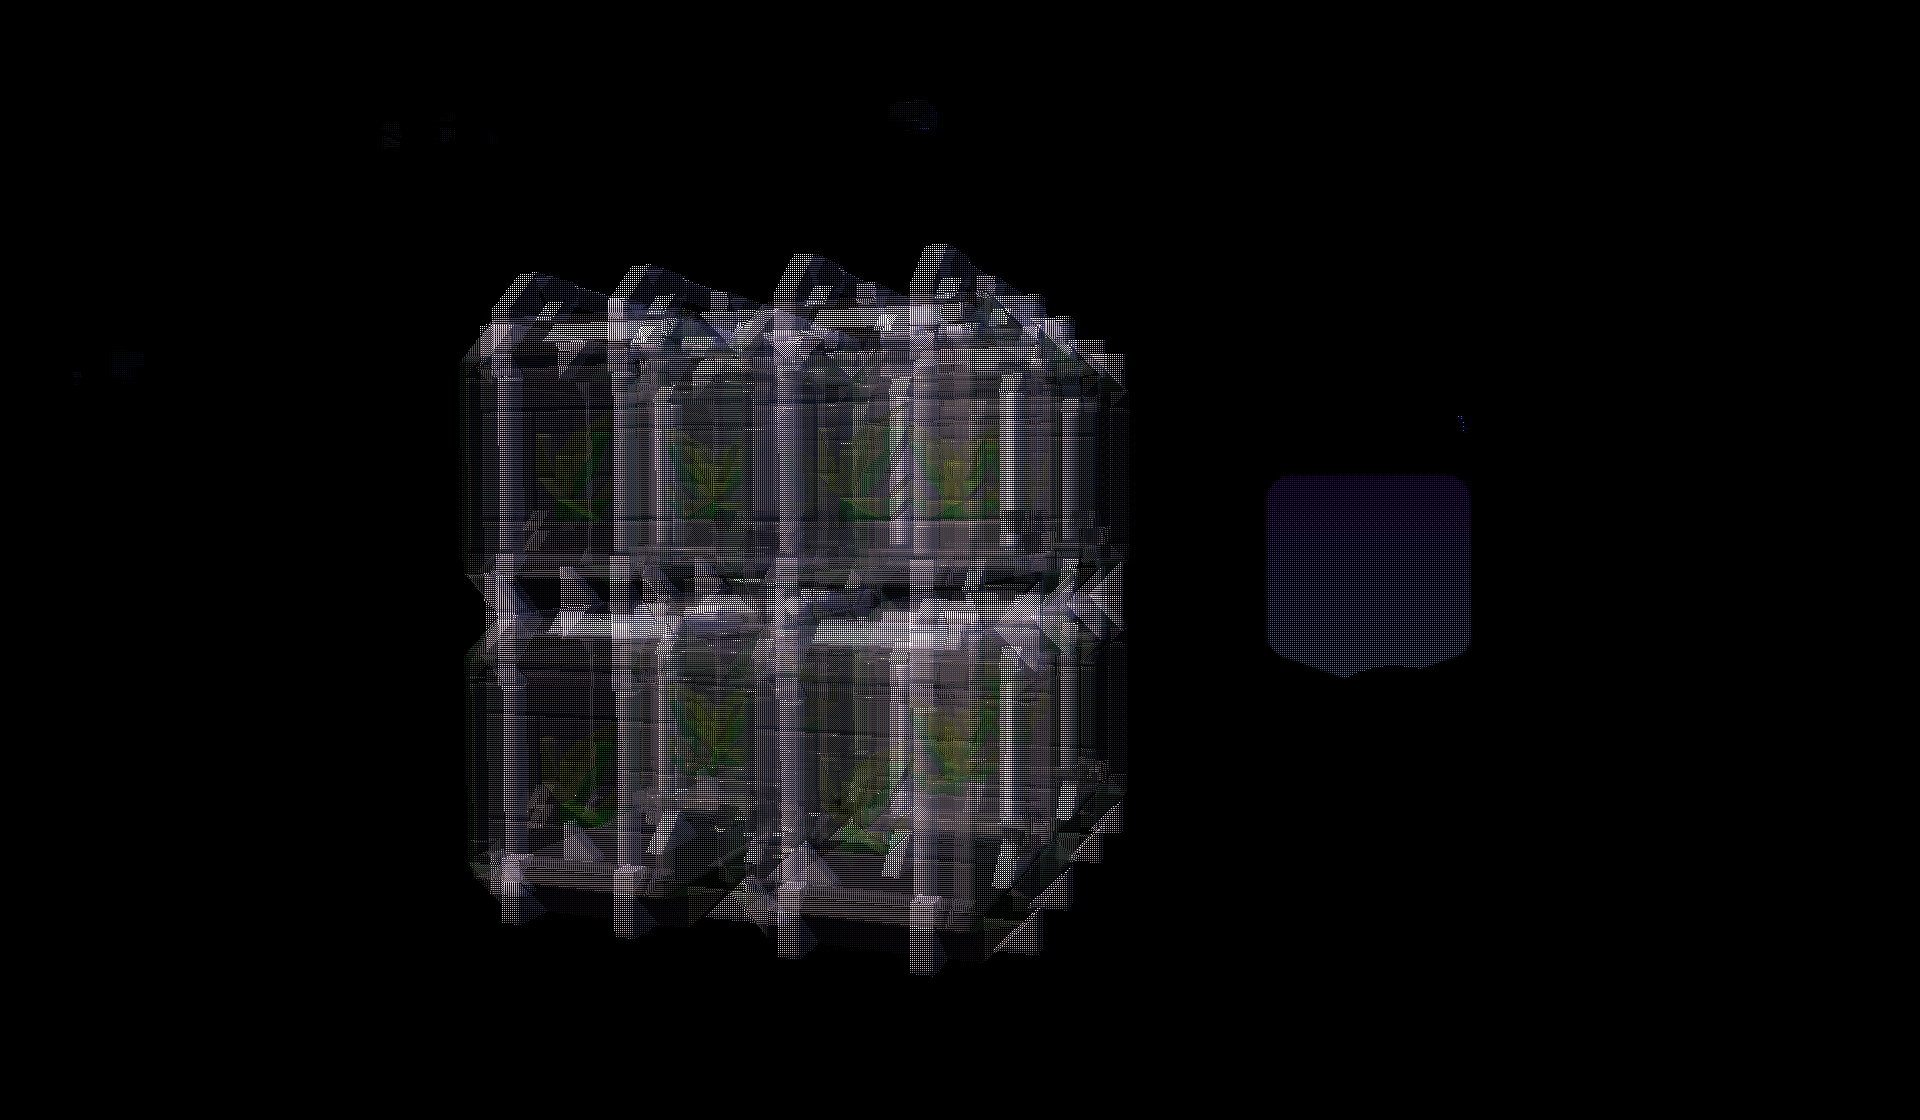
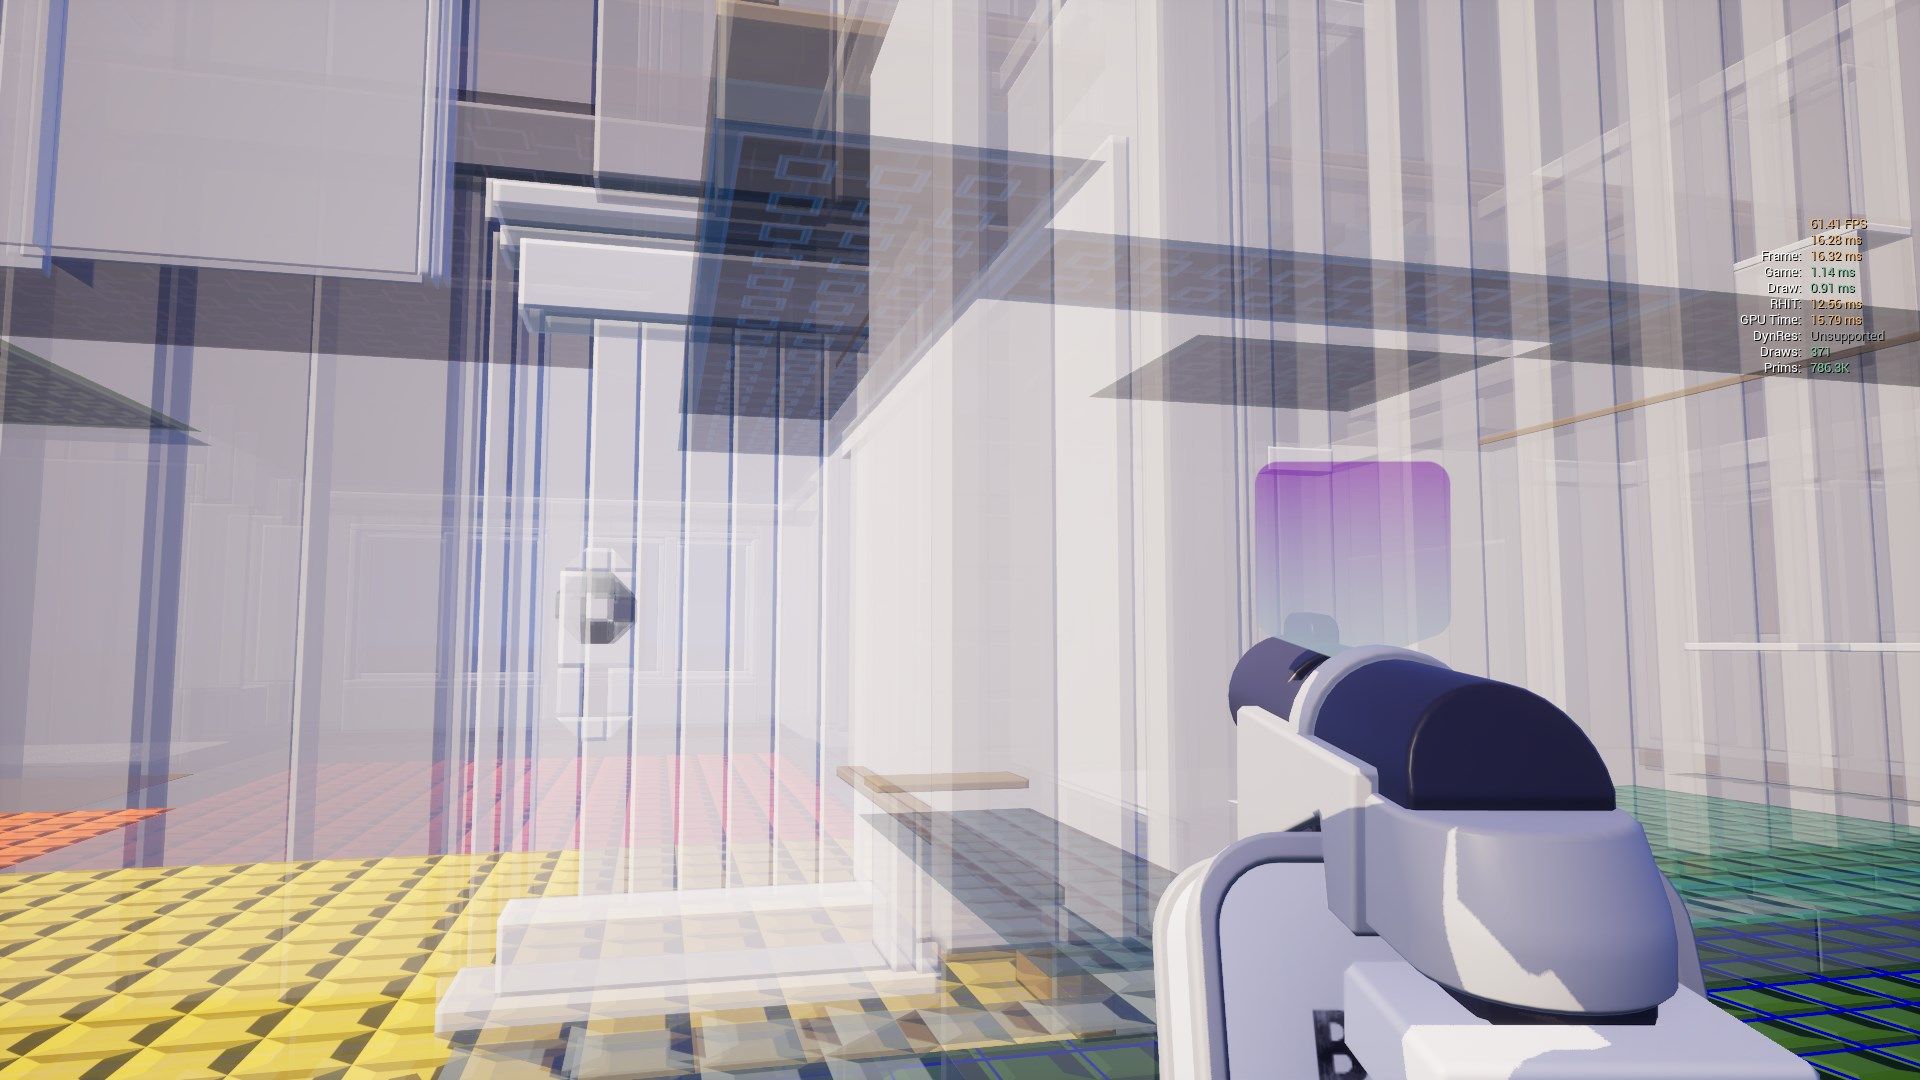
So this idea was a complete failure. Let's try that again, but this time armed with more understanding of what's happening behind the scenes. To really visualize the issue with the reflection rays going outside the screen, we need to take our sketch from above and upgrade it to be 3-dimensional.
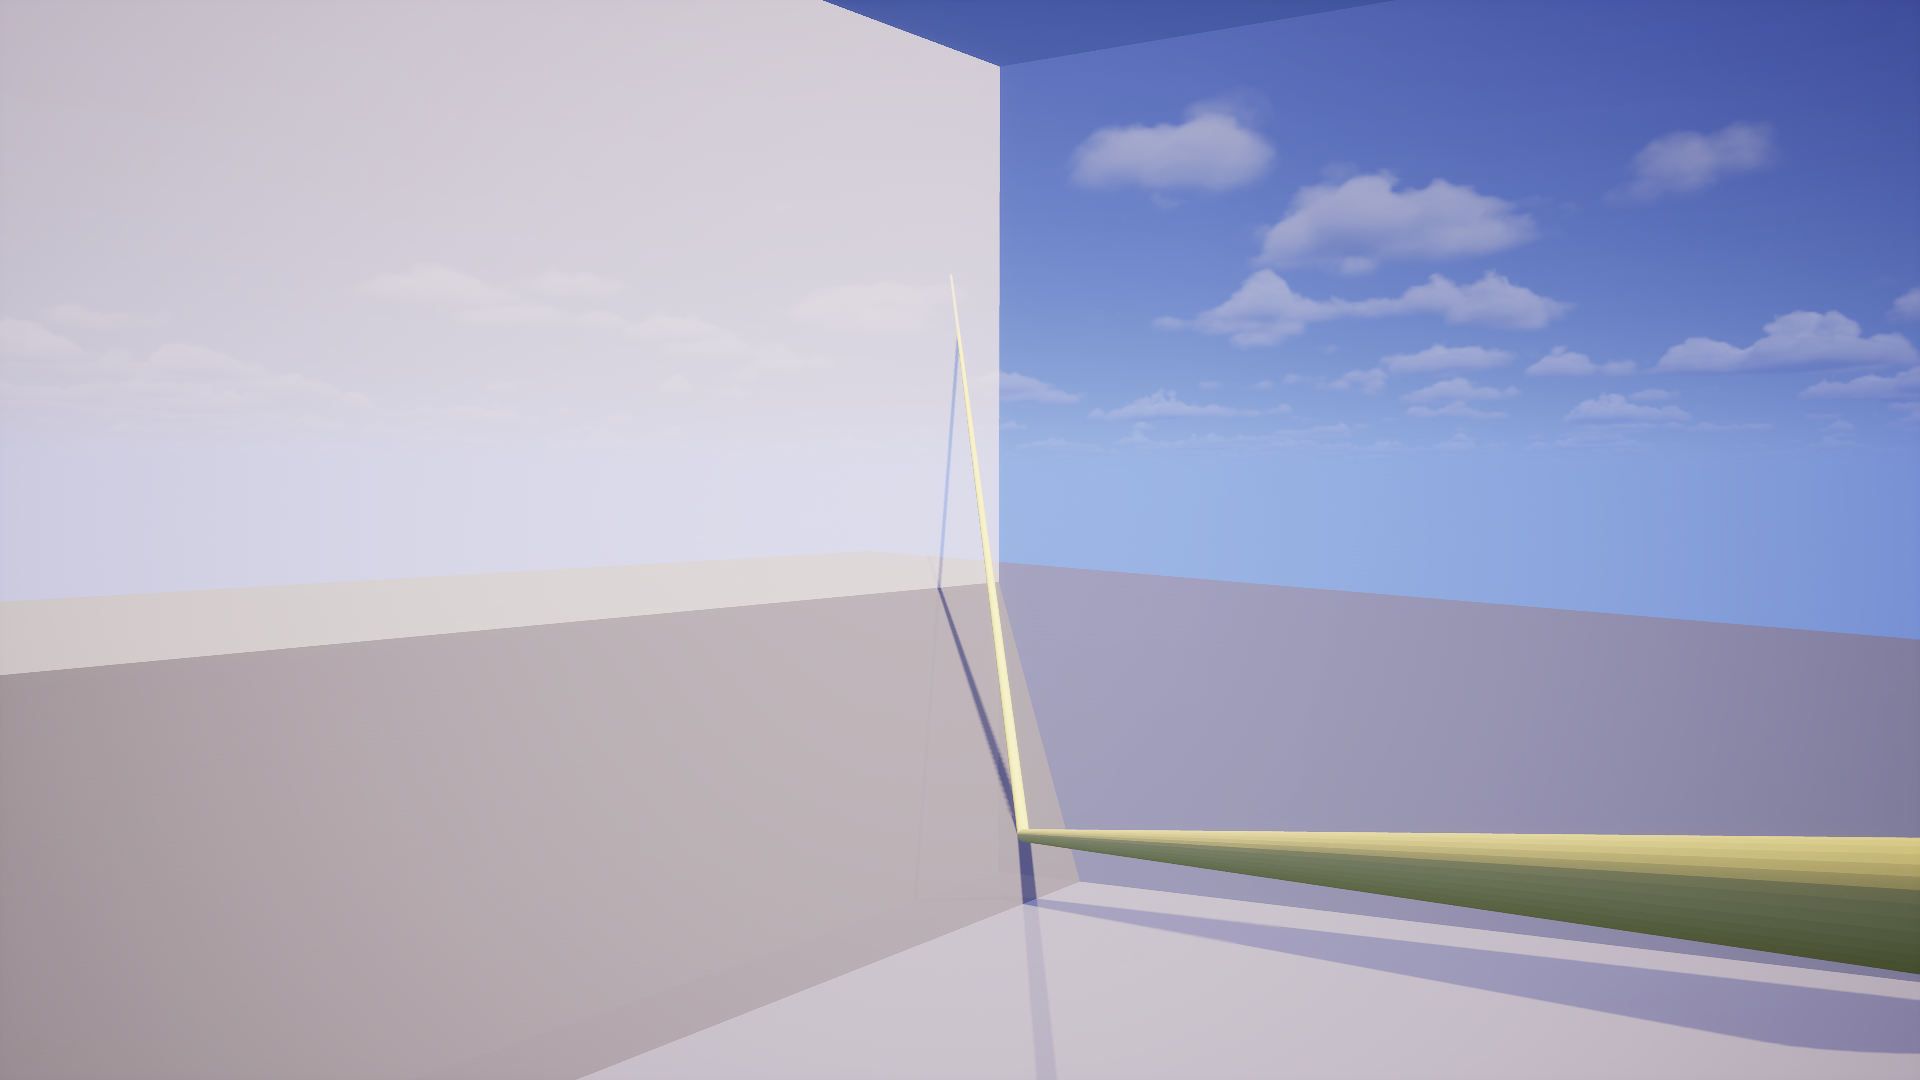
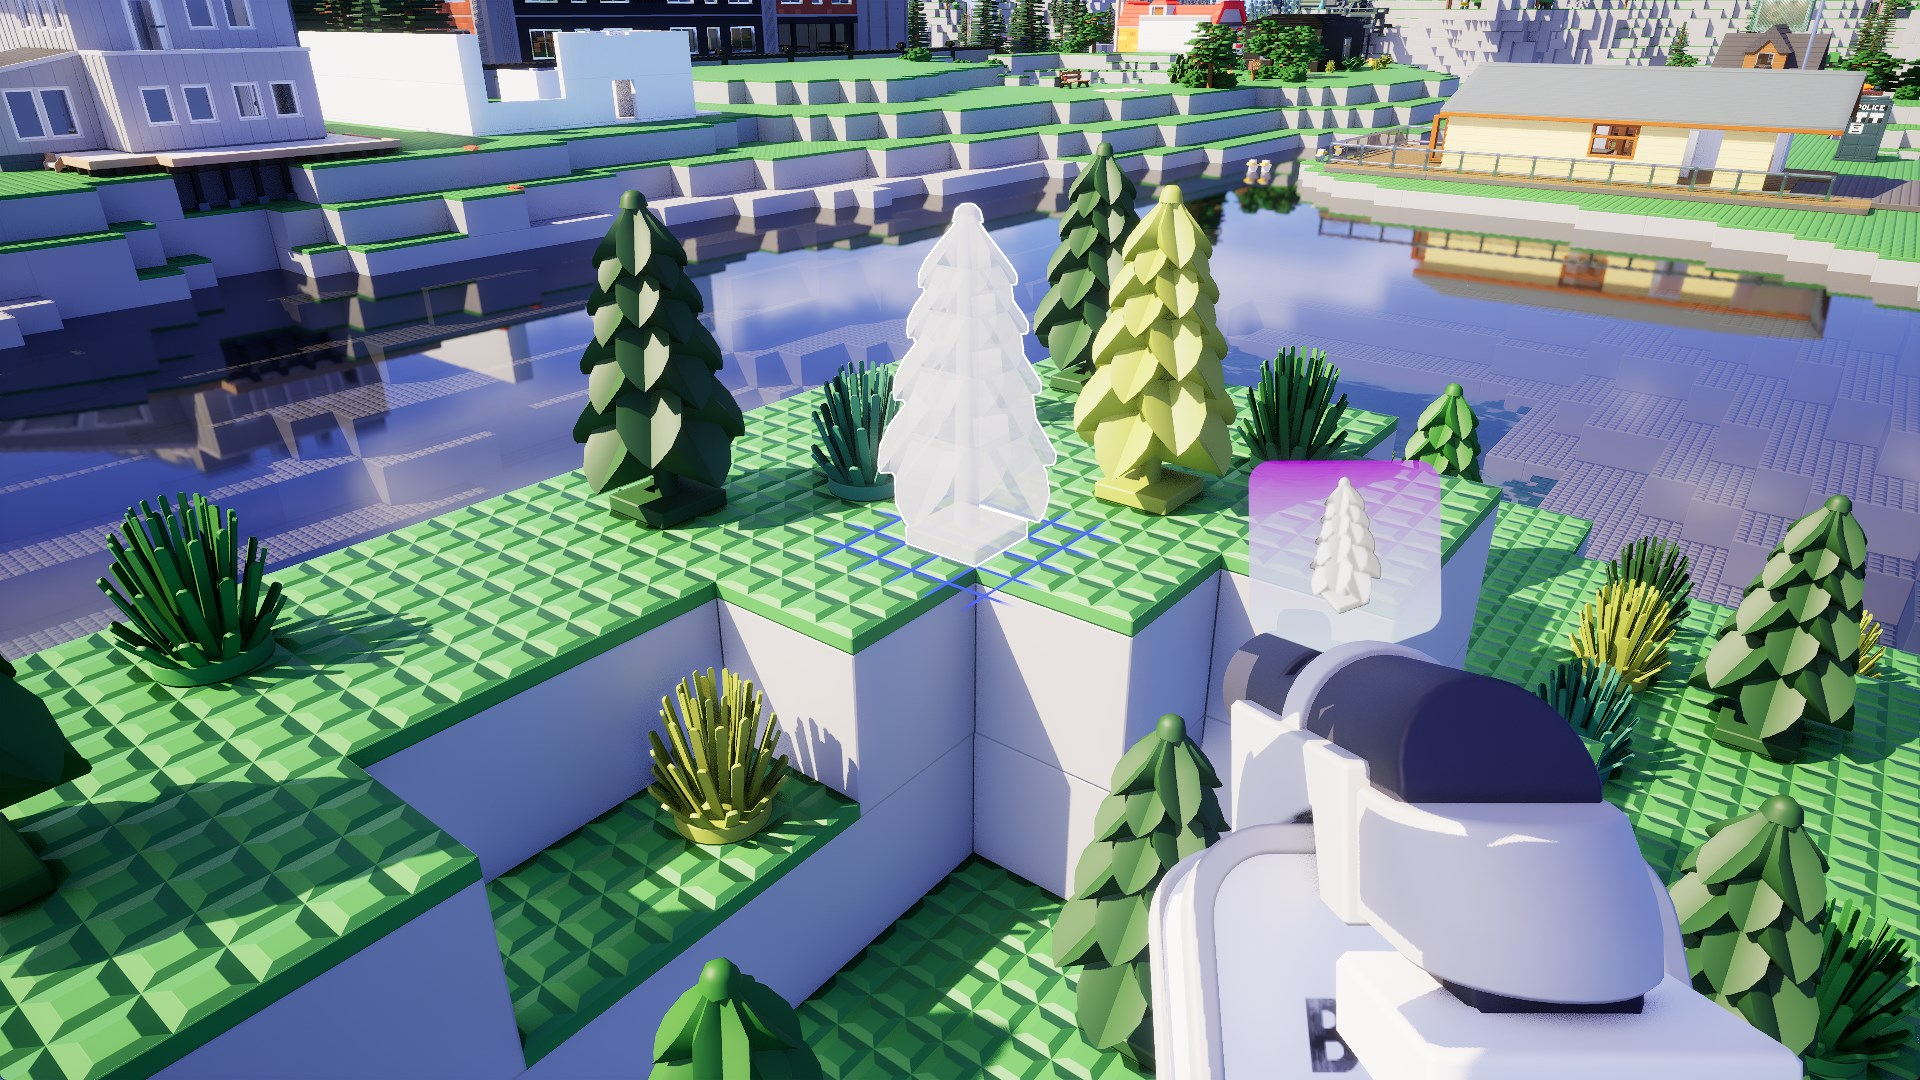
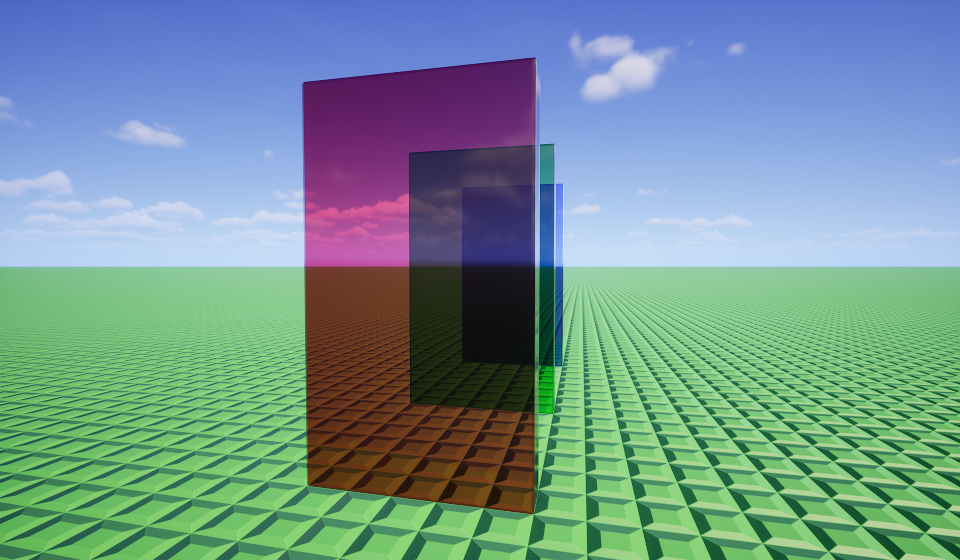
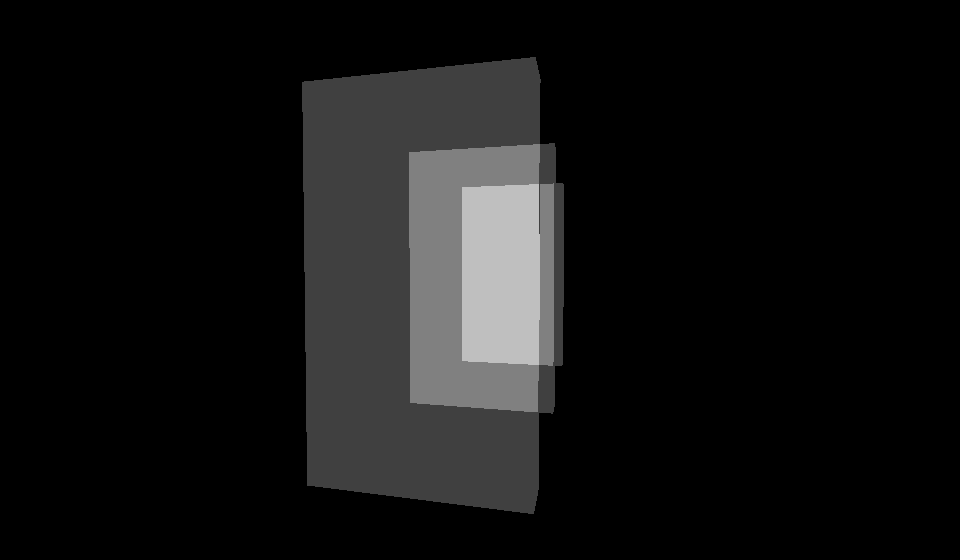
I don't really have a good software to visualize this kind of stuff, so I used a bunch of translucent shapes in Unreal Engine. As long as it gets the idea across, the method doesn't matter, right? Ignore that there's a sky in the background, it's not relevant to our visualization.
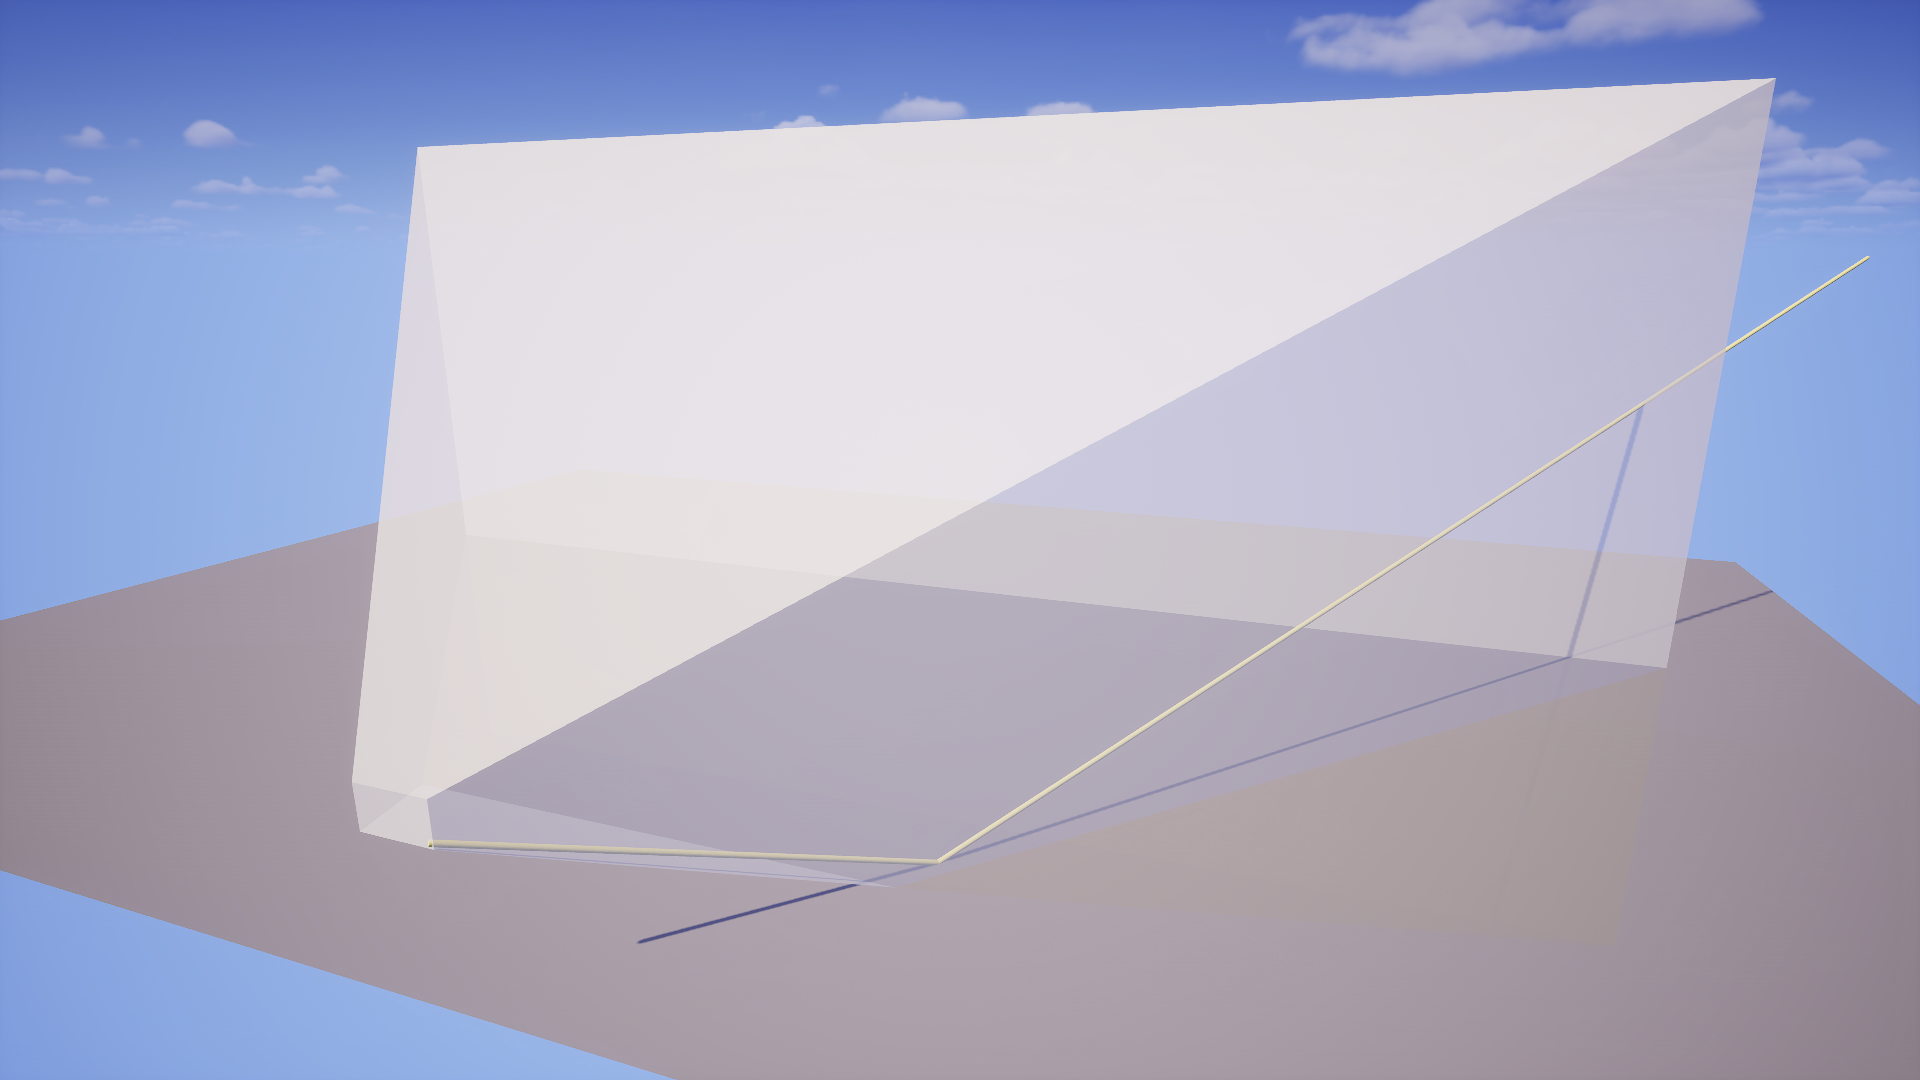
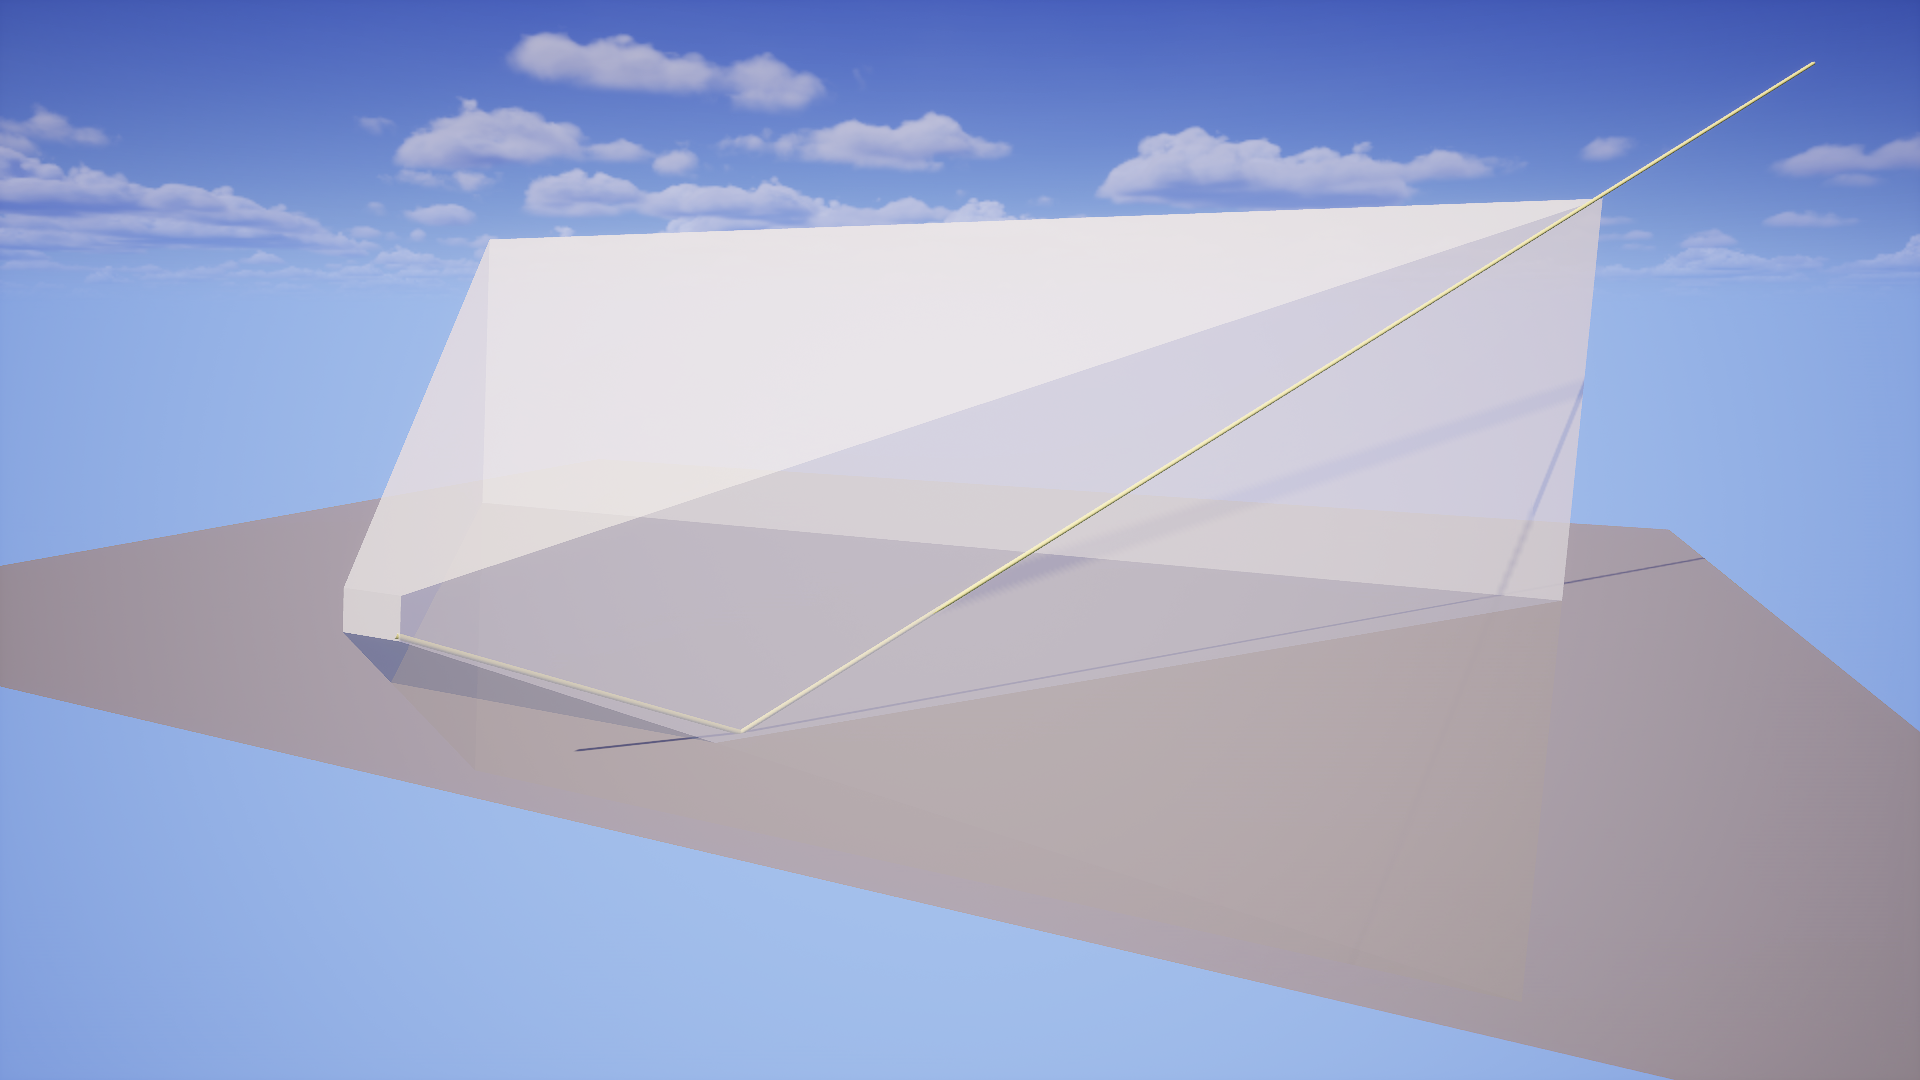
The grey plane at the bottom represents the lake. The light grey shape that gets larger in the distance represents your camera. This is actually a fairly reasonable approximation of a view frustum for a camera with 16:9 aspect ratio and a 55° vertical field of view. The rod inside represents a ray from the eye towards the lake, which is then getting reflected off it. We are trying to determine the reflection for a pixel in the bottom right of the screen.
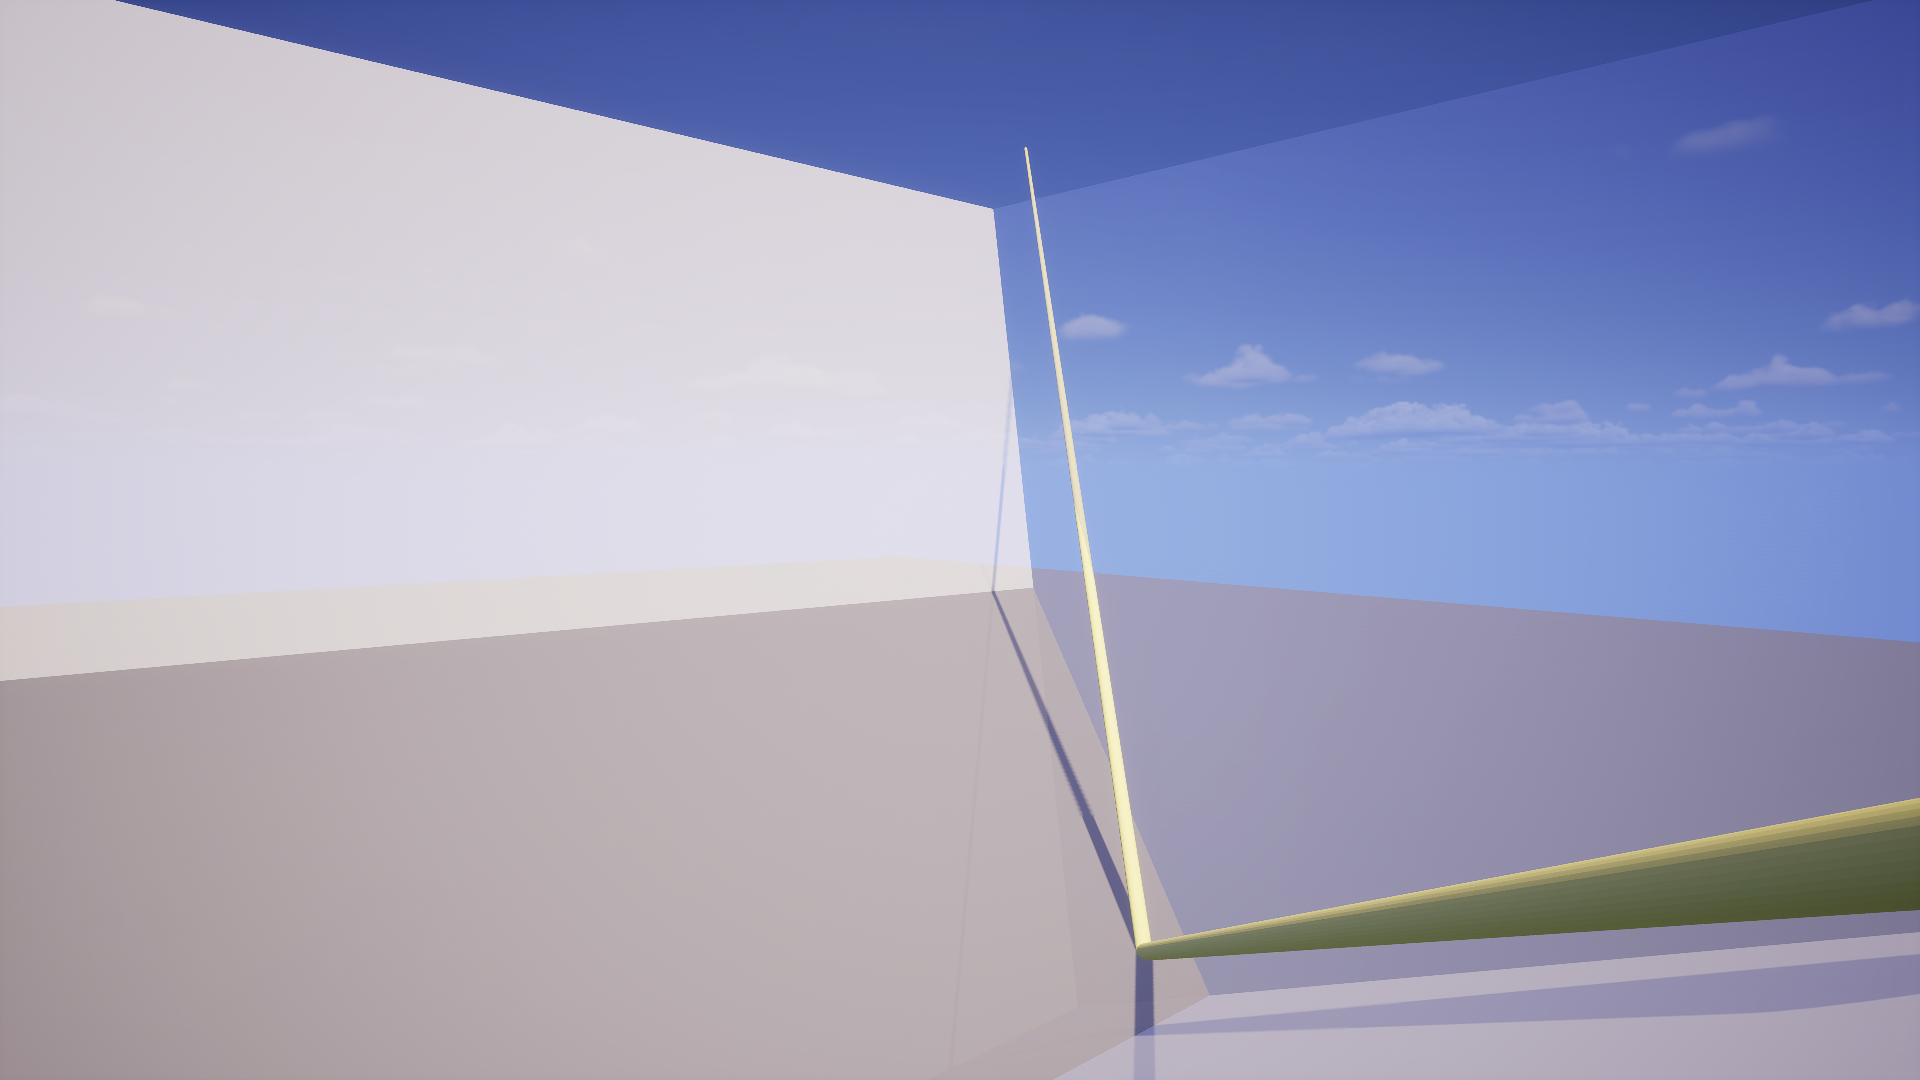
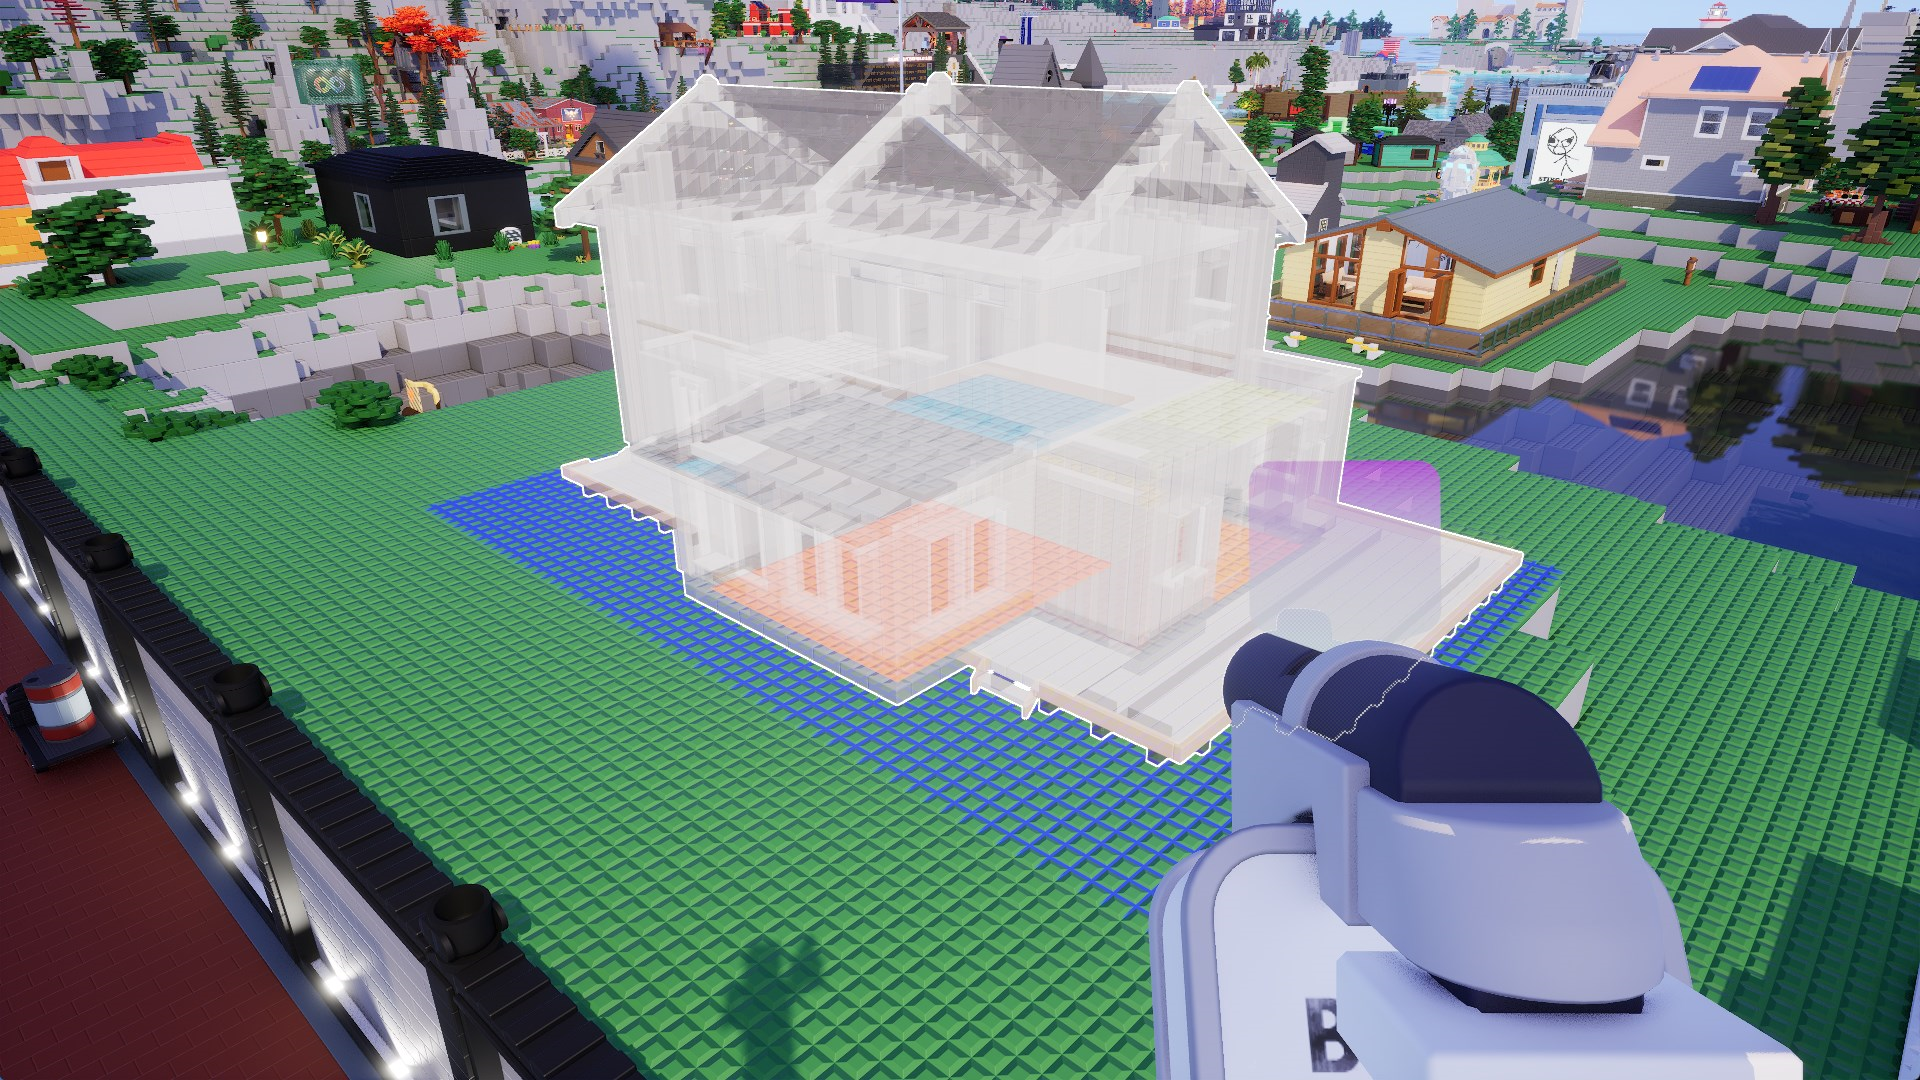
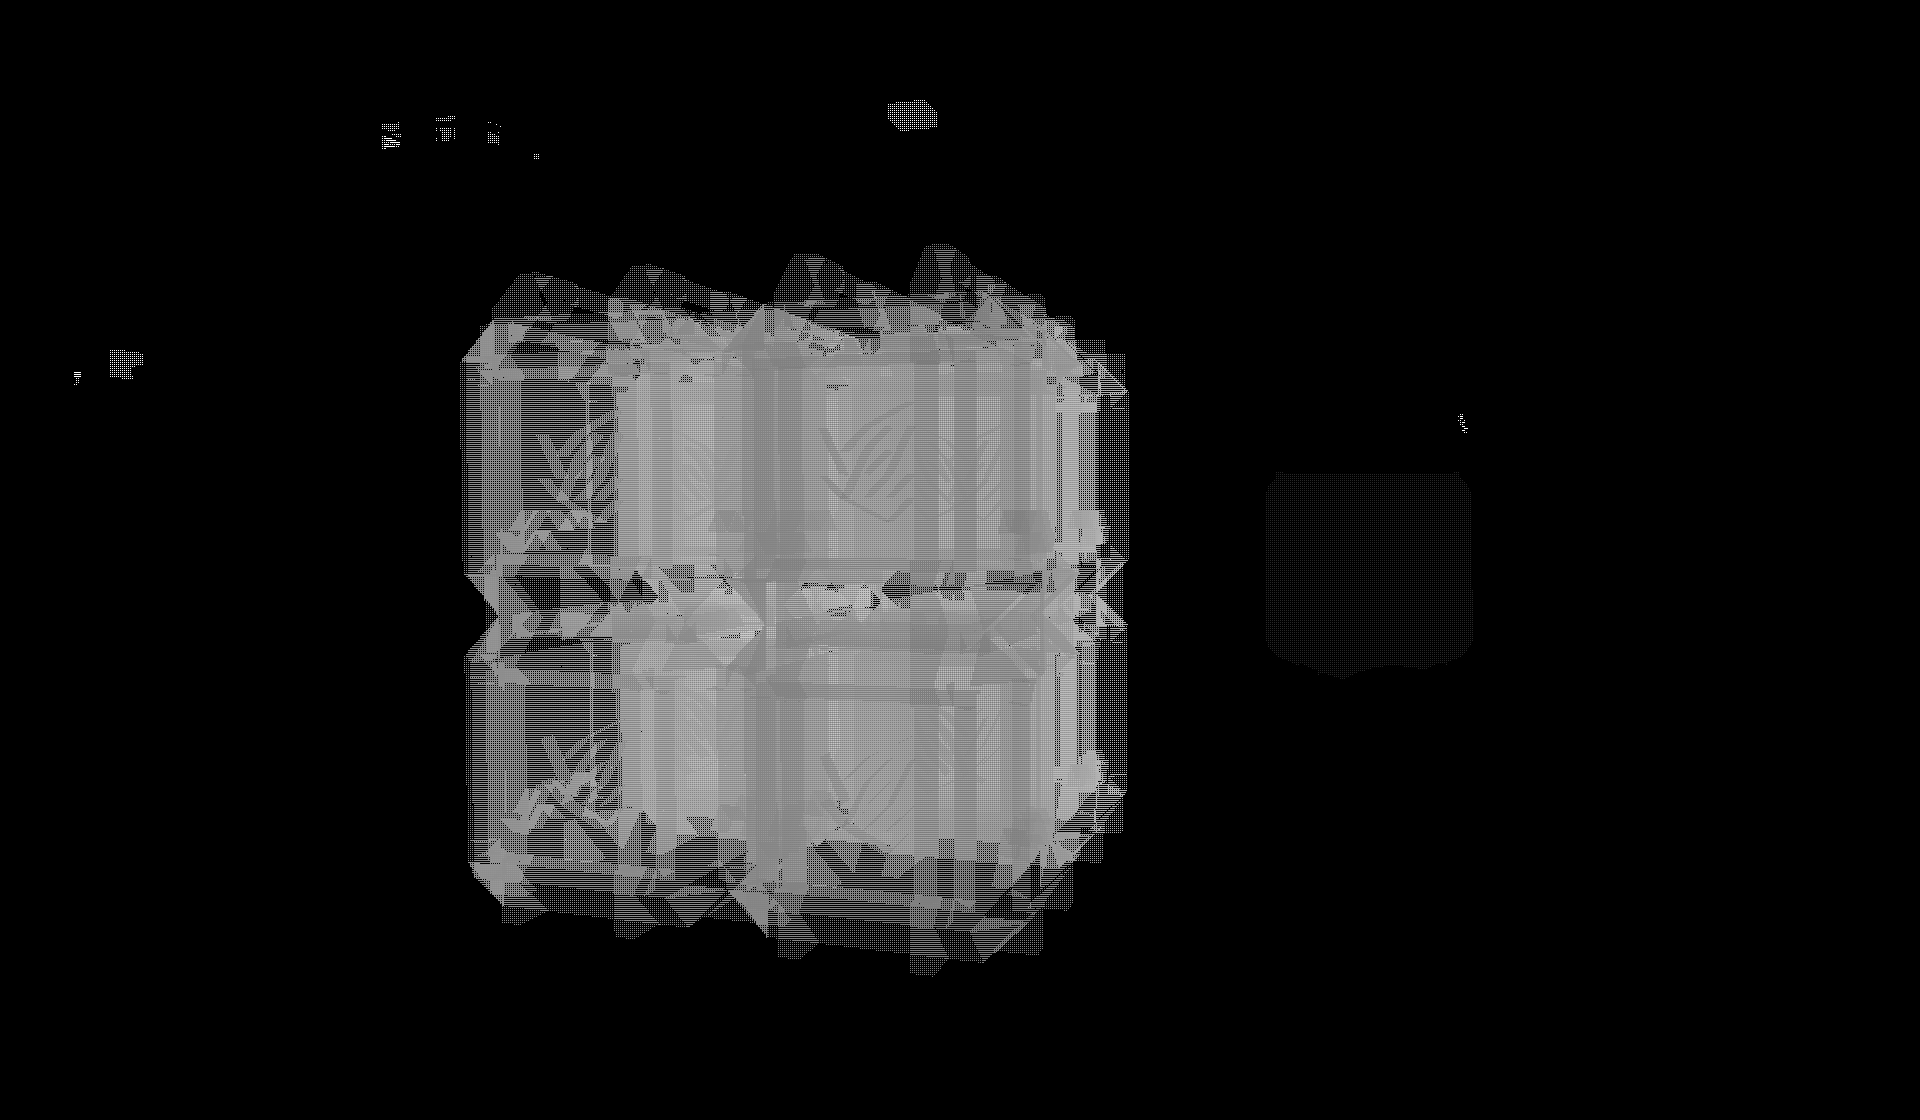
You can see how as long as the camera is aiming straight horizontal, the ray will remain within the view frustum, i.e. it will intersect with the large back wall (shown by its shadow, or the image below, where I flew inside the thing).
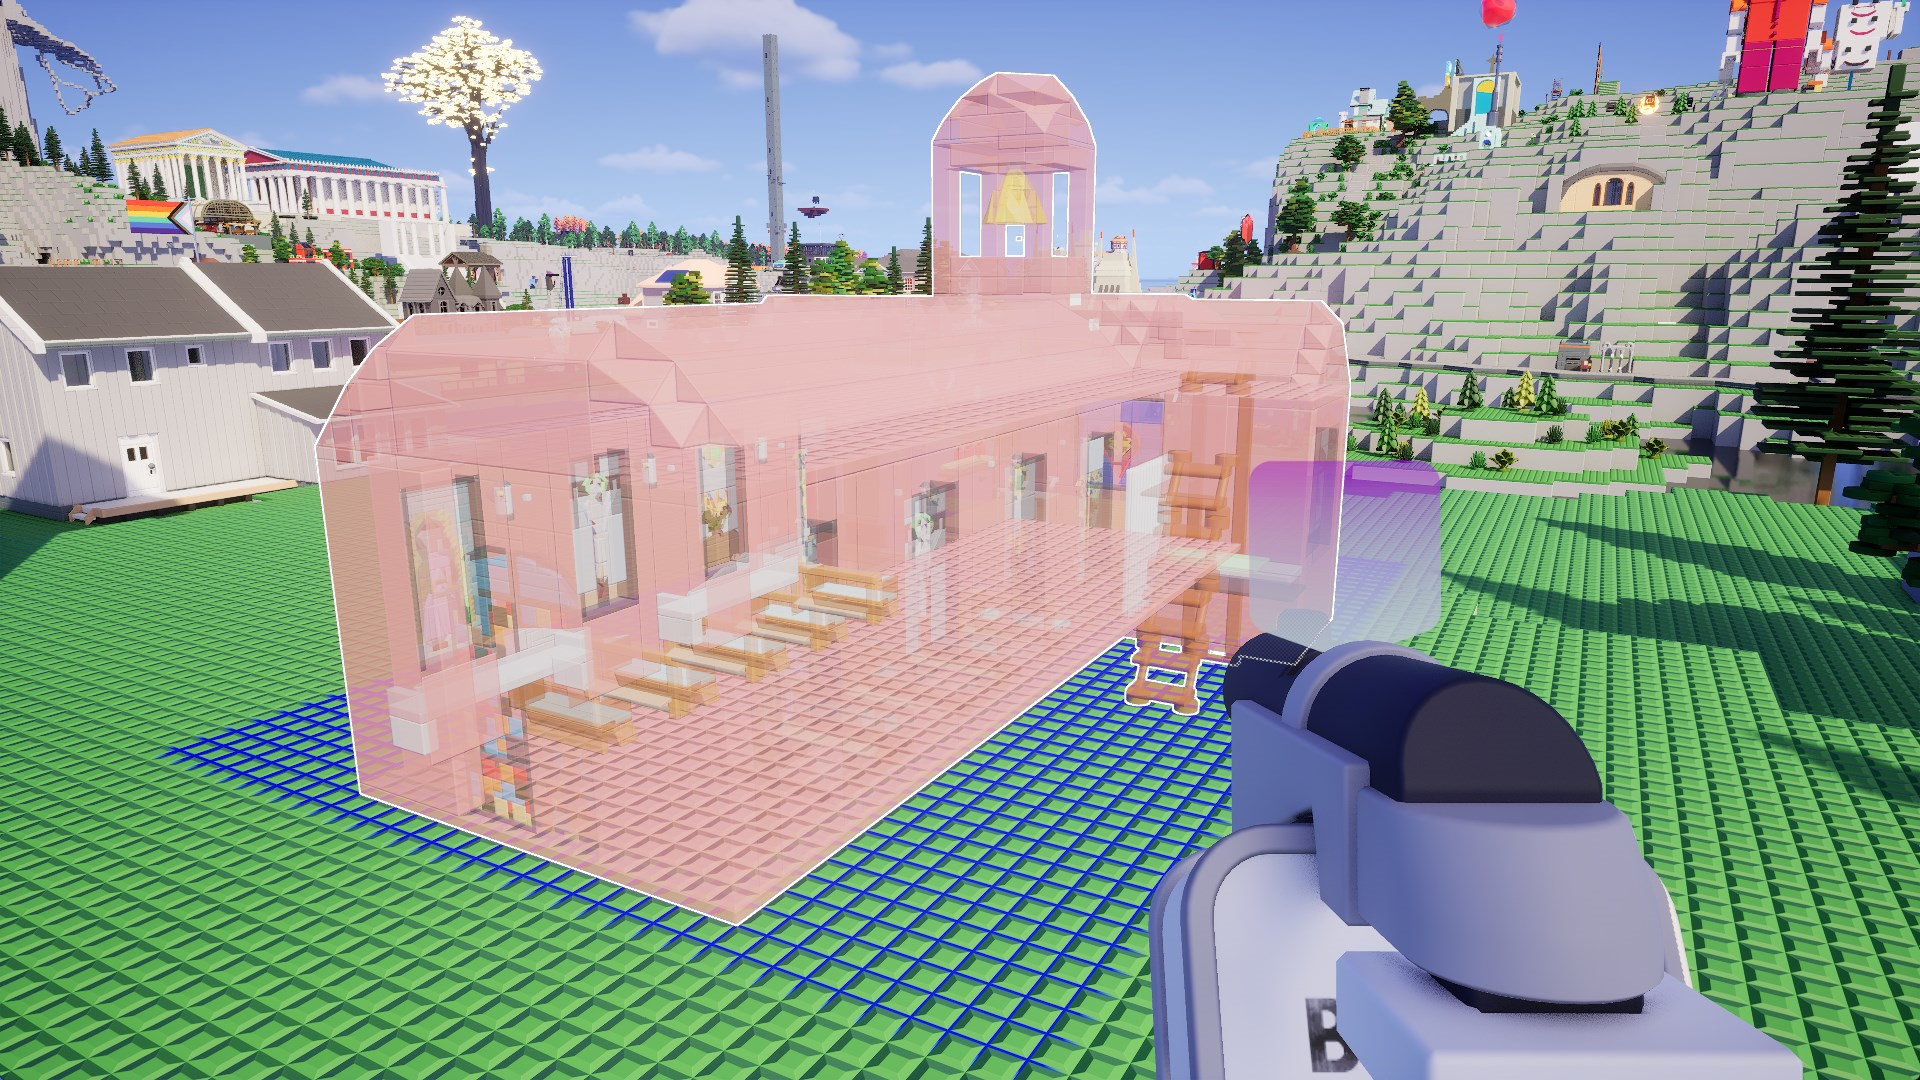
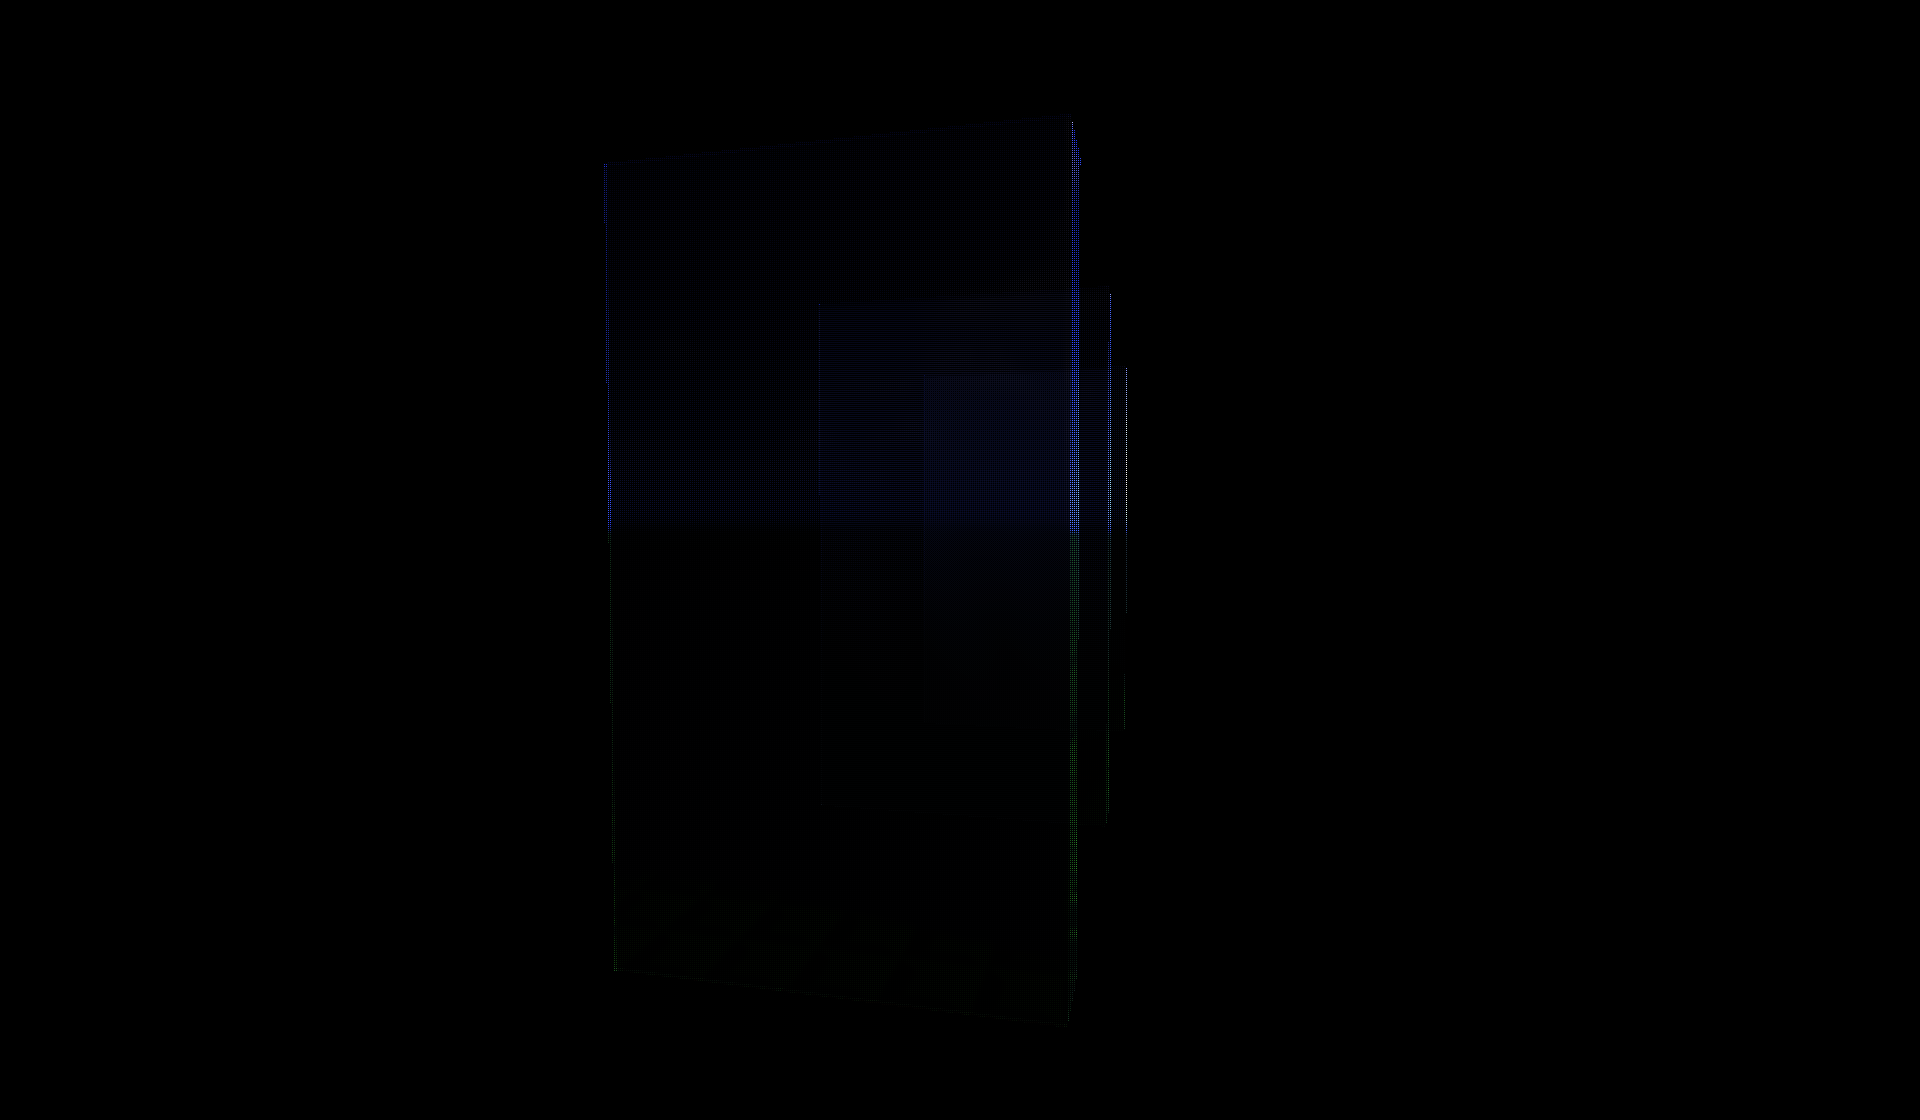
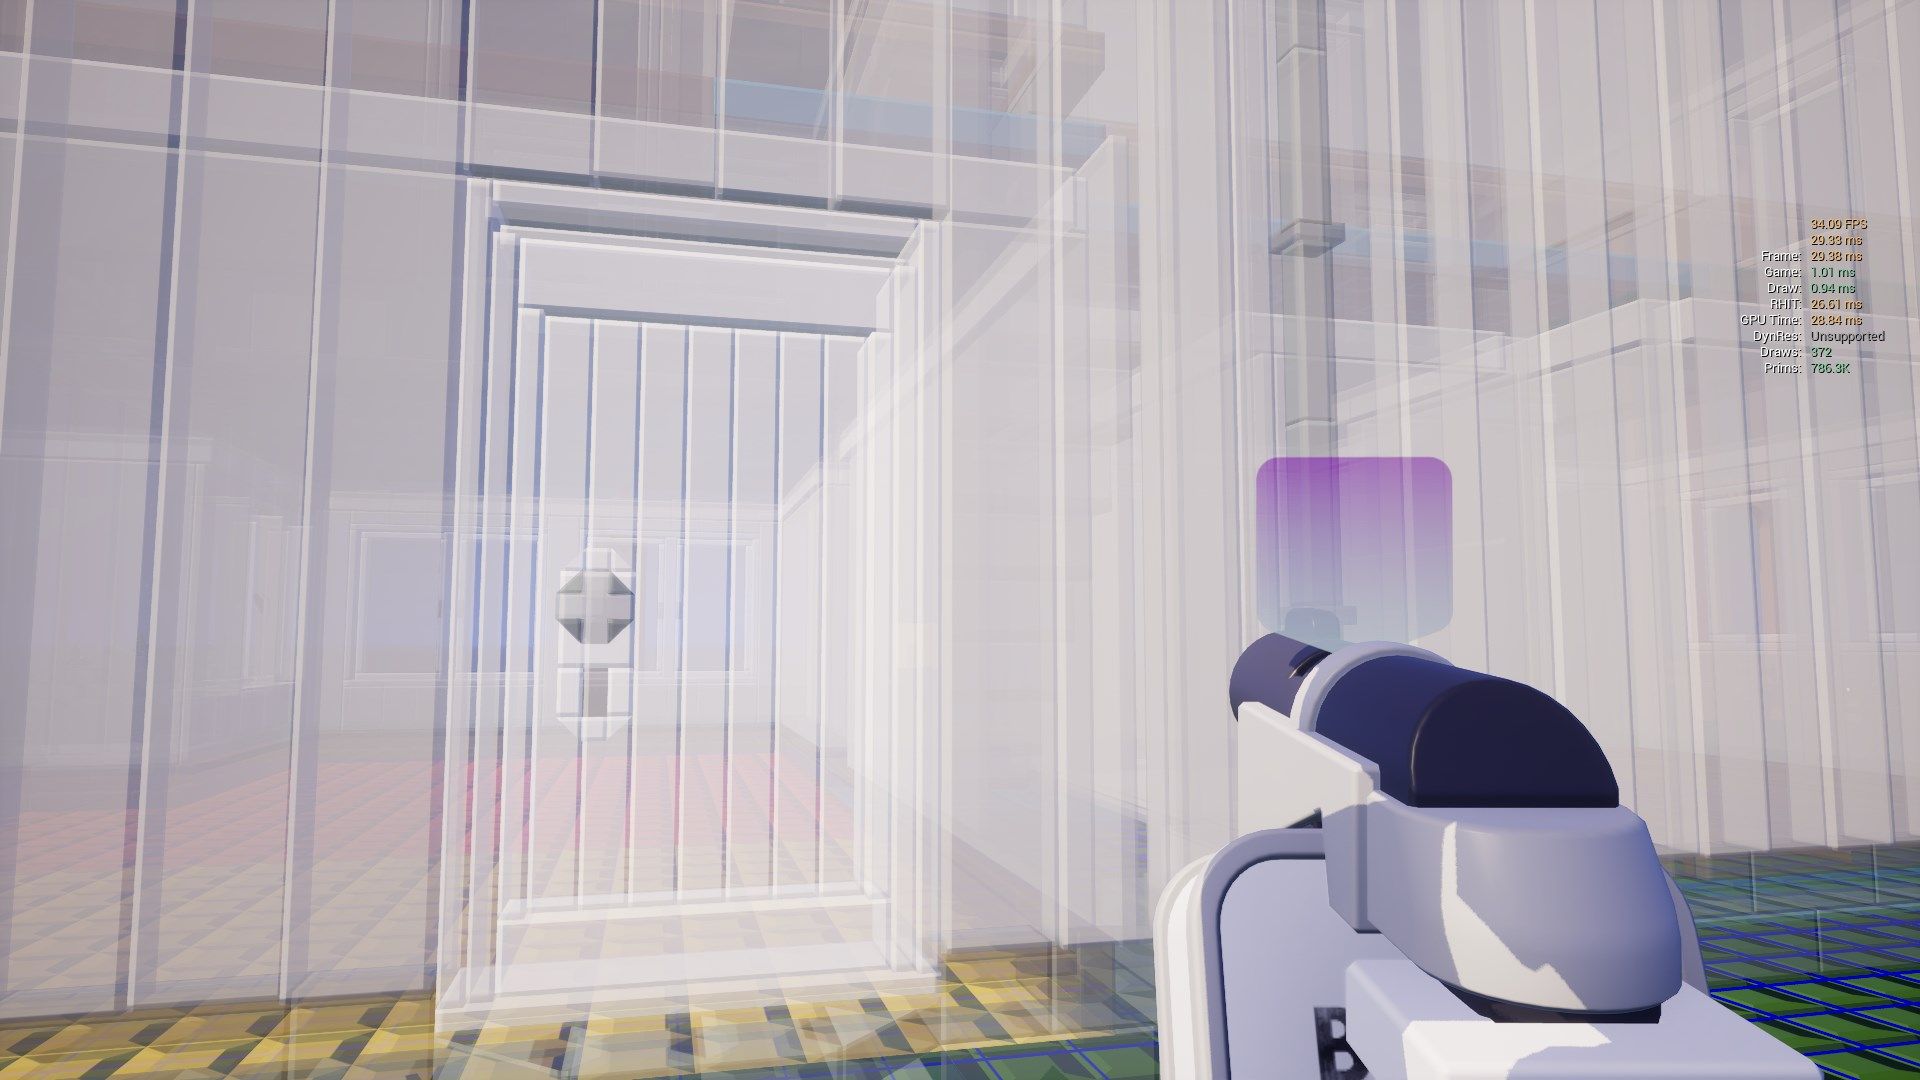
That all looks reasonable so far. But what if we rotate the camera down a little?
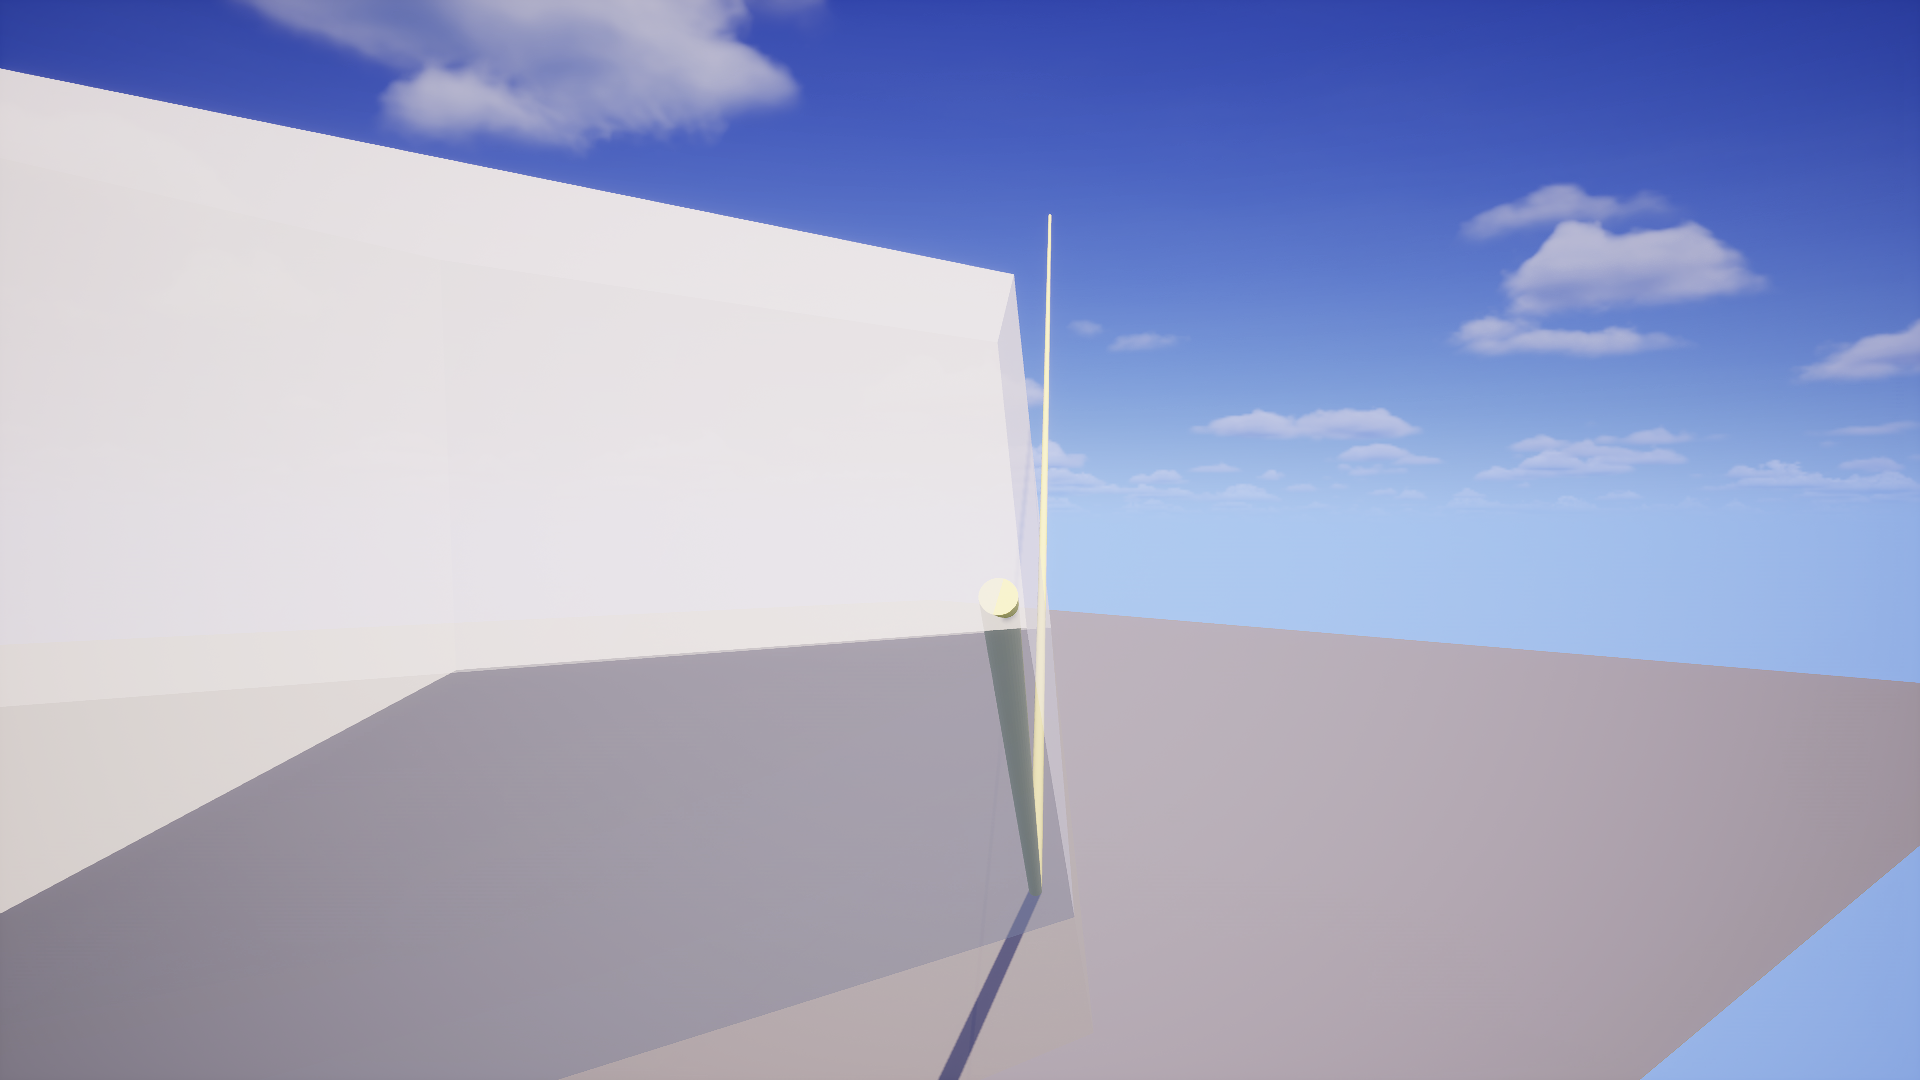
Uh oh! With the camera pointing down, our reflection ray is leaving the view frustum to the side. This is exactly what is happening with the diagonal edge in the screenshots above.
This happens because with the camera pointing down, the right side of our view frustum actually ends up at an angle, when compared to the Z axis going straight up. So even though we are still reflecting straight up off the flat water, it is leaving our view to the side.
Hopefully this 3d visualization helped in some way. But now that we understand where our reflection ray is going, what do we do with this information?
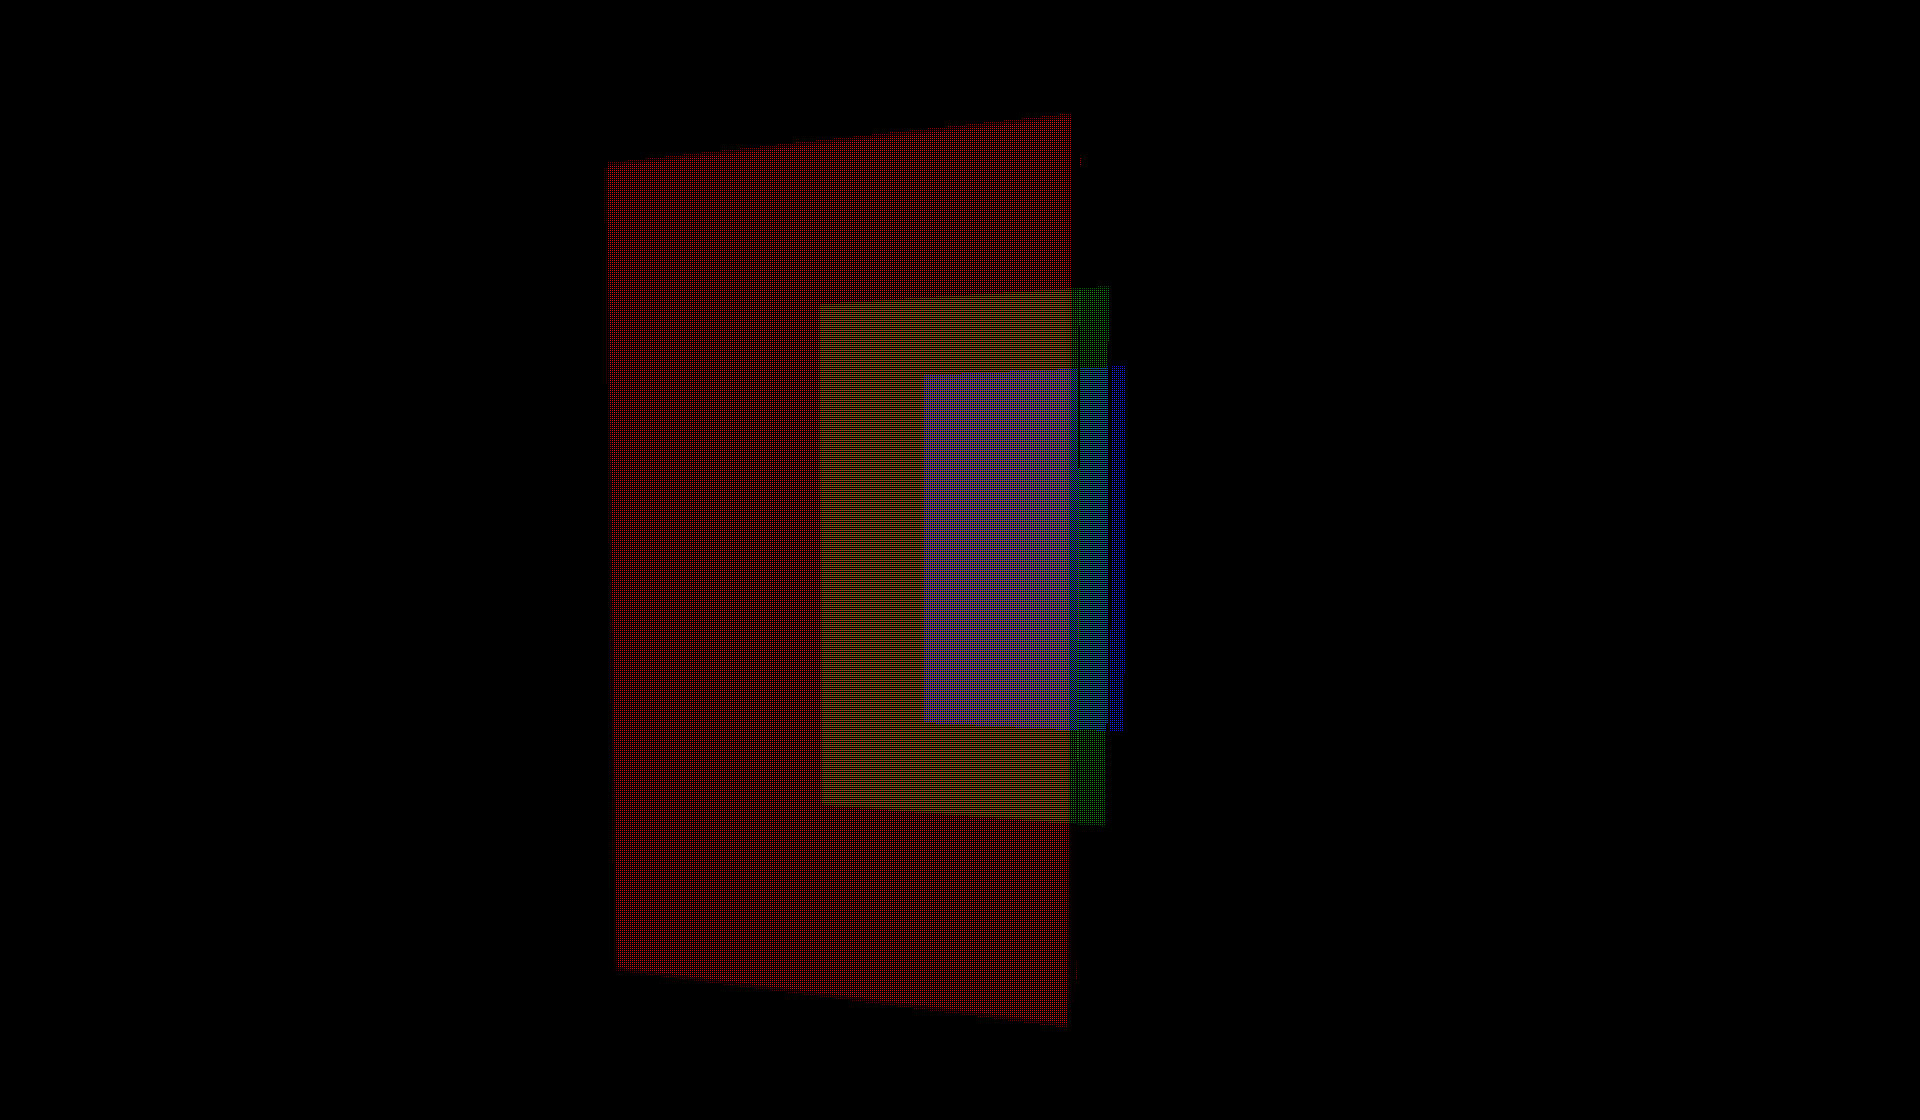
Essentially, what we want to accomplish is to make sure the reflected rays stay within the view frustum. To do this, we have to switch to a different coordinate space.
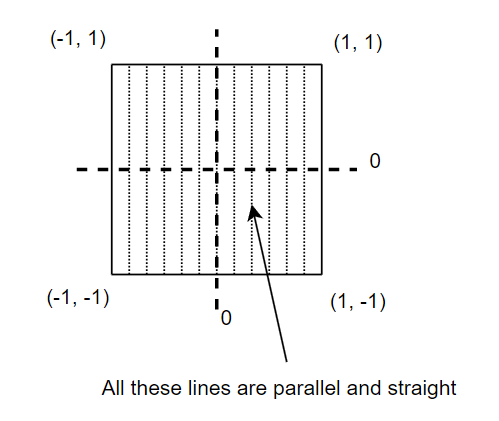
Imagine a cube. It has an extent of one unit on each axis, and is centered at the origin. If you draw a top view of this cube, with the coordinate system overlaid, it looks somewhat like the below image. You could consider this something like cube-space, and a set of coordinates between -1 and 1 on each axis would let you position something anywhere relative to the cube.
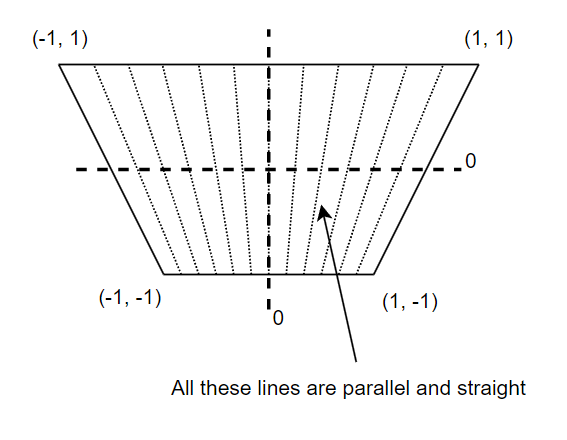
We can do the same thing for the view frustum of our camera above, except we stretch it, like the below image. You can now use coordinates between -1 and 1 to position something anywhere within the view frustum.
In graphics programming, this is normally called "clip space", because objects outside of the unit cube will be clipped by the edges of the screen. The part we care about though, is that parallel lines starting inside the view and going "forward" in this coordinate space will remain within the view. We can visualize our reflection ray going off screen (red) in this coordinate space.
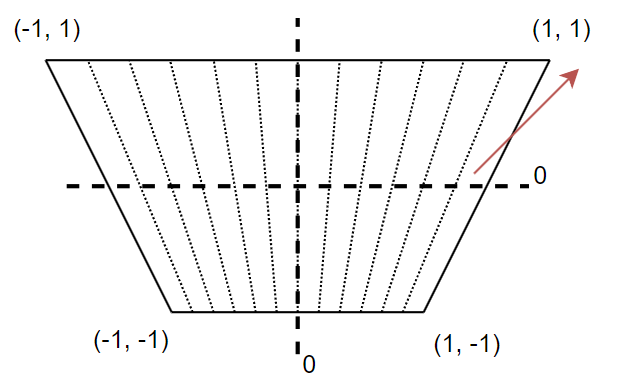
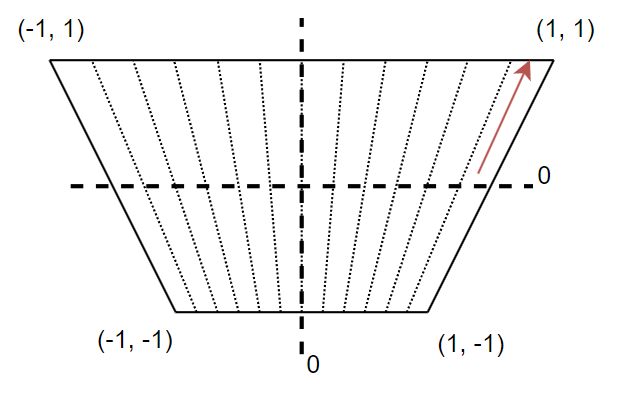
All we have to do to ensure we get a valid reflection point, is align it to face straight forward in clip space. This is as easy as ensuring the x component of its direction is equal to 0.
Let's try to implement this in the shader and see how it looks!
Let's try that one more time, shall we?
Well, we have indeed fixed the edges. But... this is not the way either, is it? Now everything is horribly distorted as we move the camera around! Argh...
One last try before we give up, what if we kept this effect but only applied it towards the edges, fading it out towards the center where most of the attention goes?
It seems like this works pretty well! It isn't perfect by any means (it cannot be, without off-screen scene information), and the distortion is still visible, but I think it's much better than the glowing white border we started with. Especially if used for something like an underground cave filled with water.
Inexact Proto-Lumen Reflections
With the screen edges solved, we still have the problem that once we turn on Proto-Lumen, most of the reflections disappear. This is because Lumen only uses screen space reflections for cases where it is certain the reflection is correct, i.e. the screen space ray does not get occluded by anything. In all other cases it tries to fall back to tracing the distance field scene instead (which we don't have!).
Luckily the fix for this is rather simple. Just... don't do that. It's going to produce a bunch of nonsense in some cases, but that's fine, the old screen space reflection effect did that too.
Final Result
Here is what this lake looks like now, if we swap the metal plate back for the glass surface that was there previously, and look at it with Proto-Lumen enabled. This improvement has no additional performance cost.
Order Independent Glass
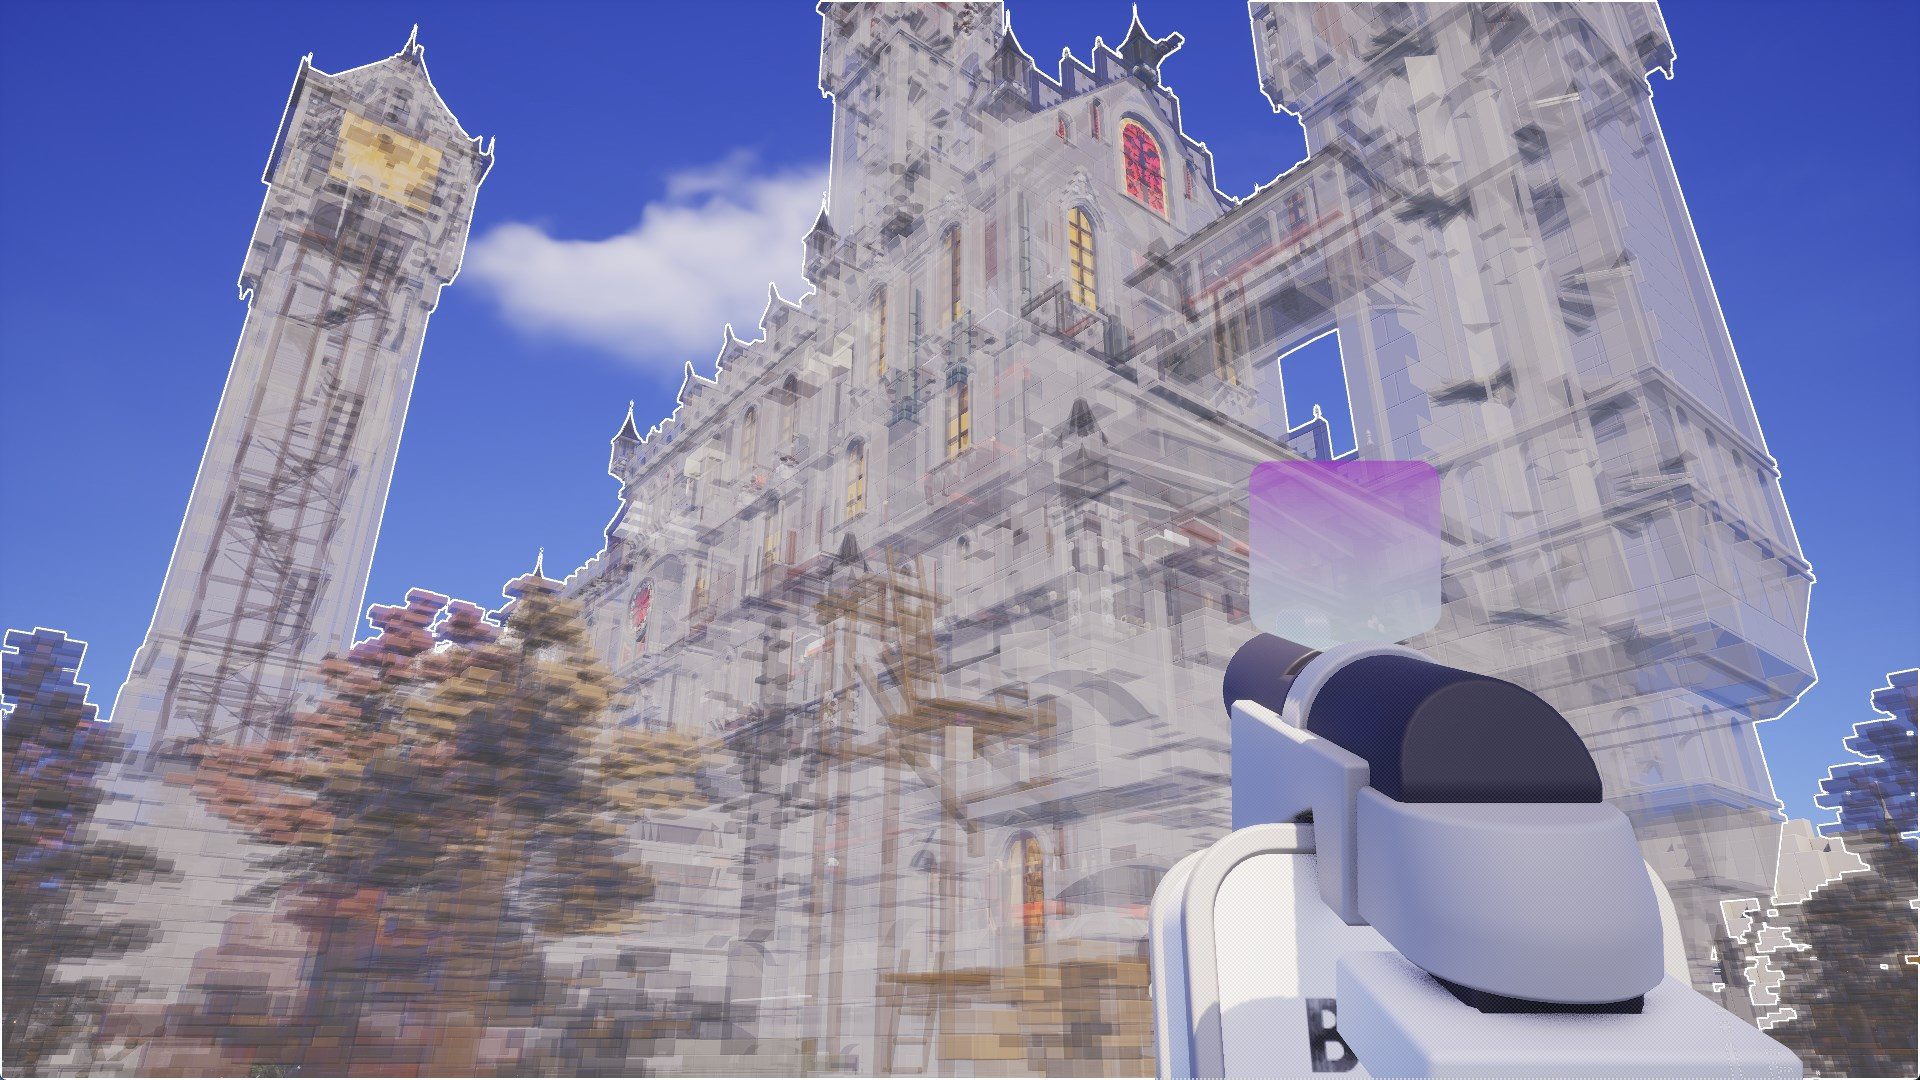
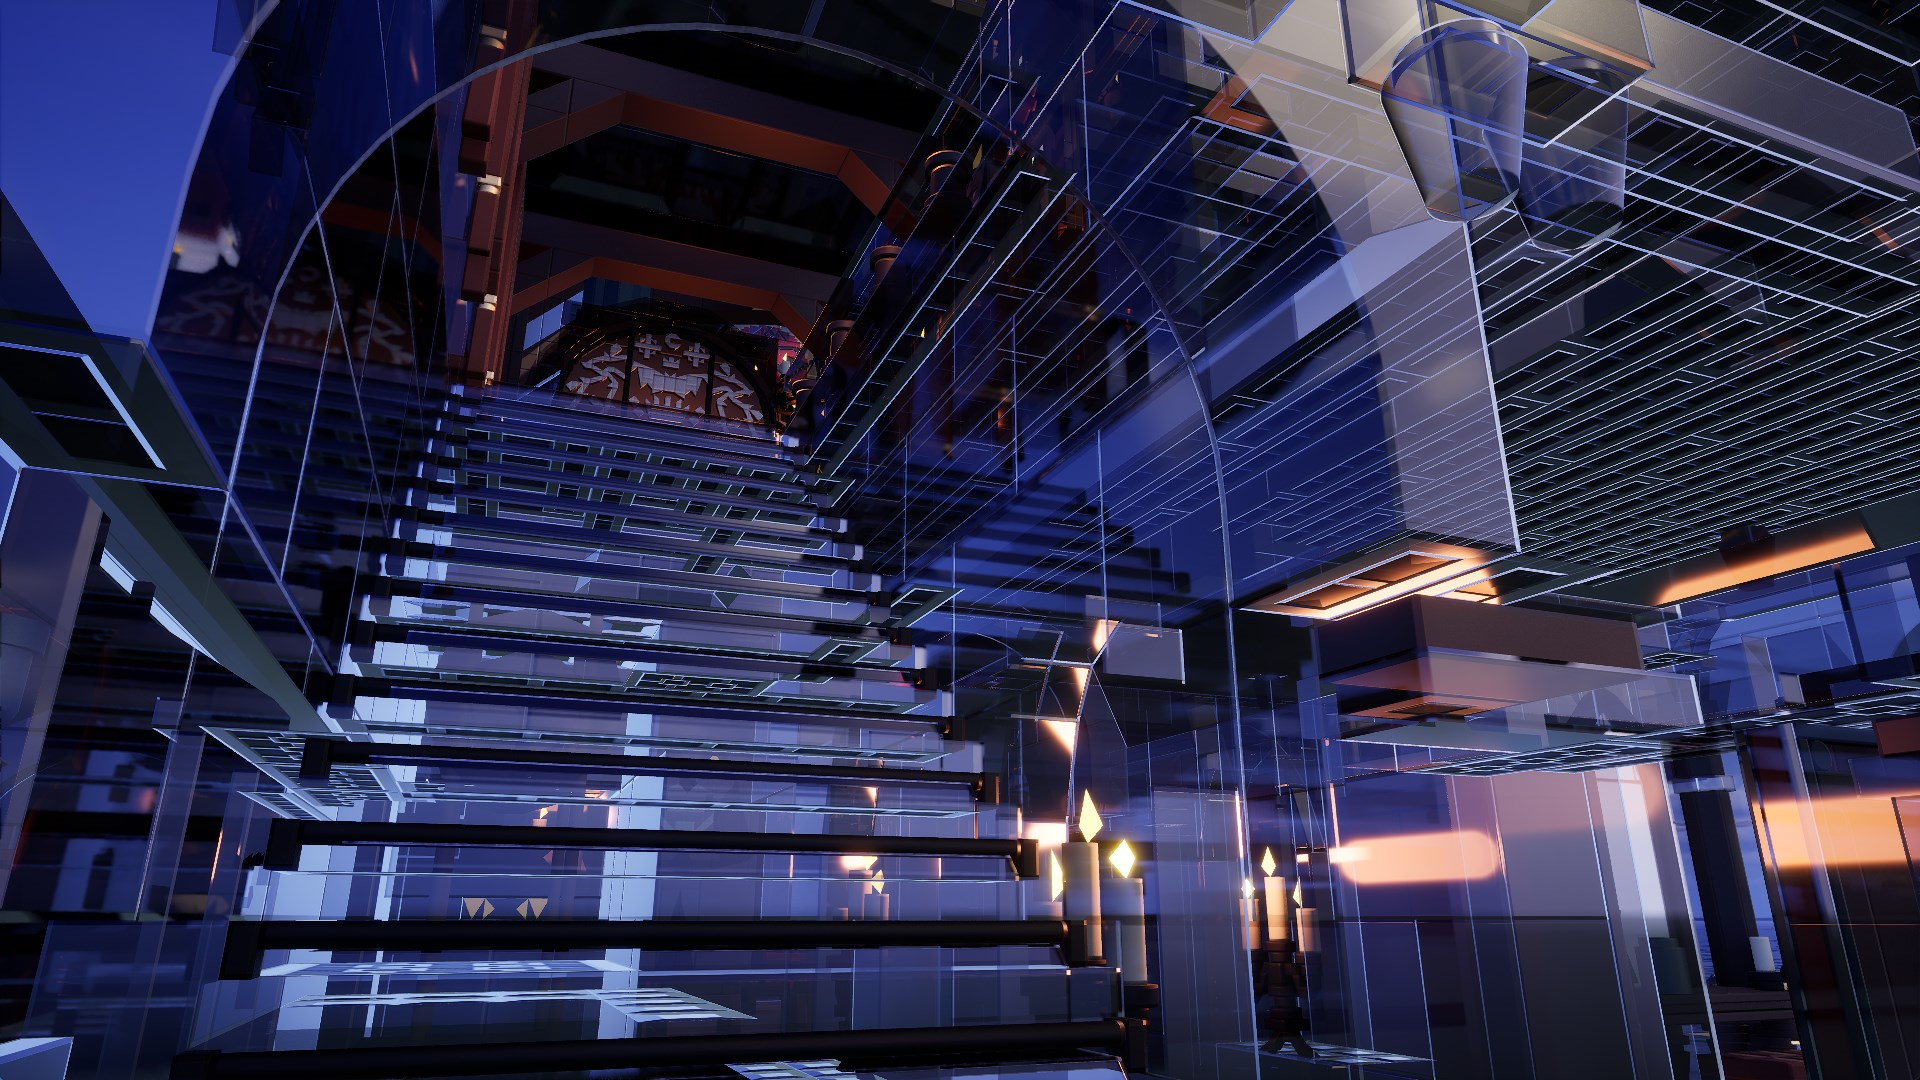
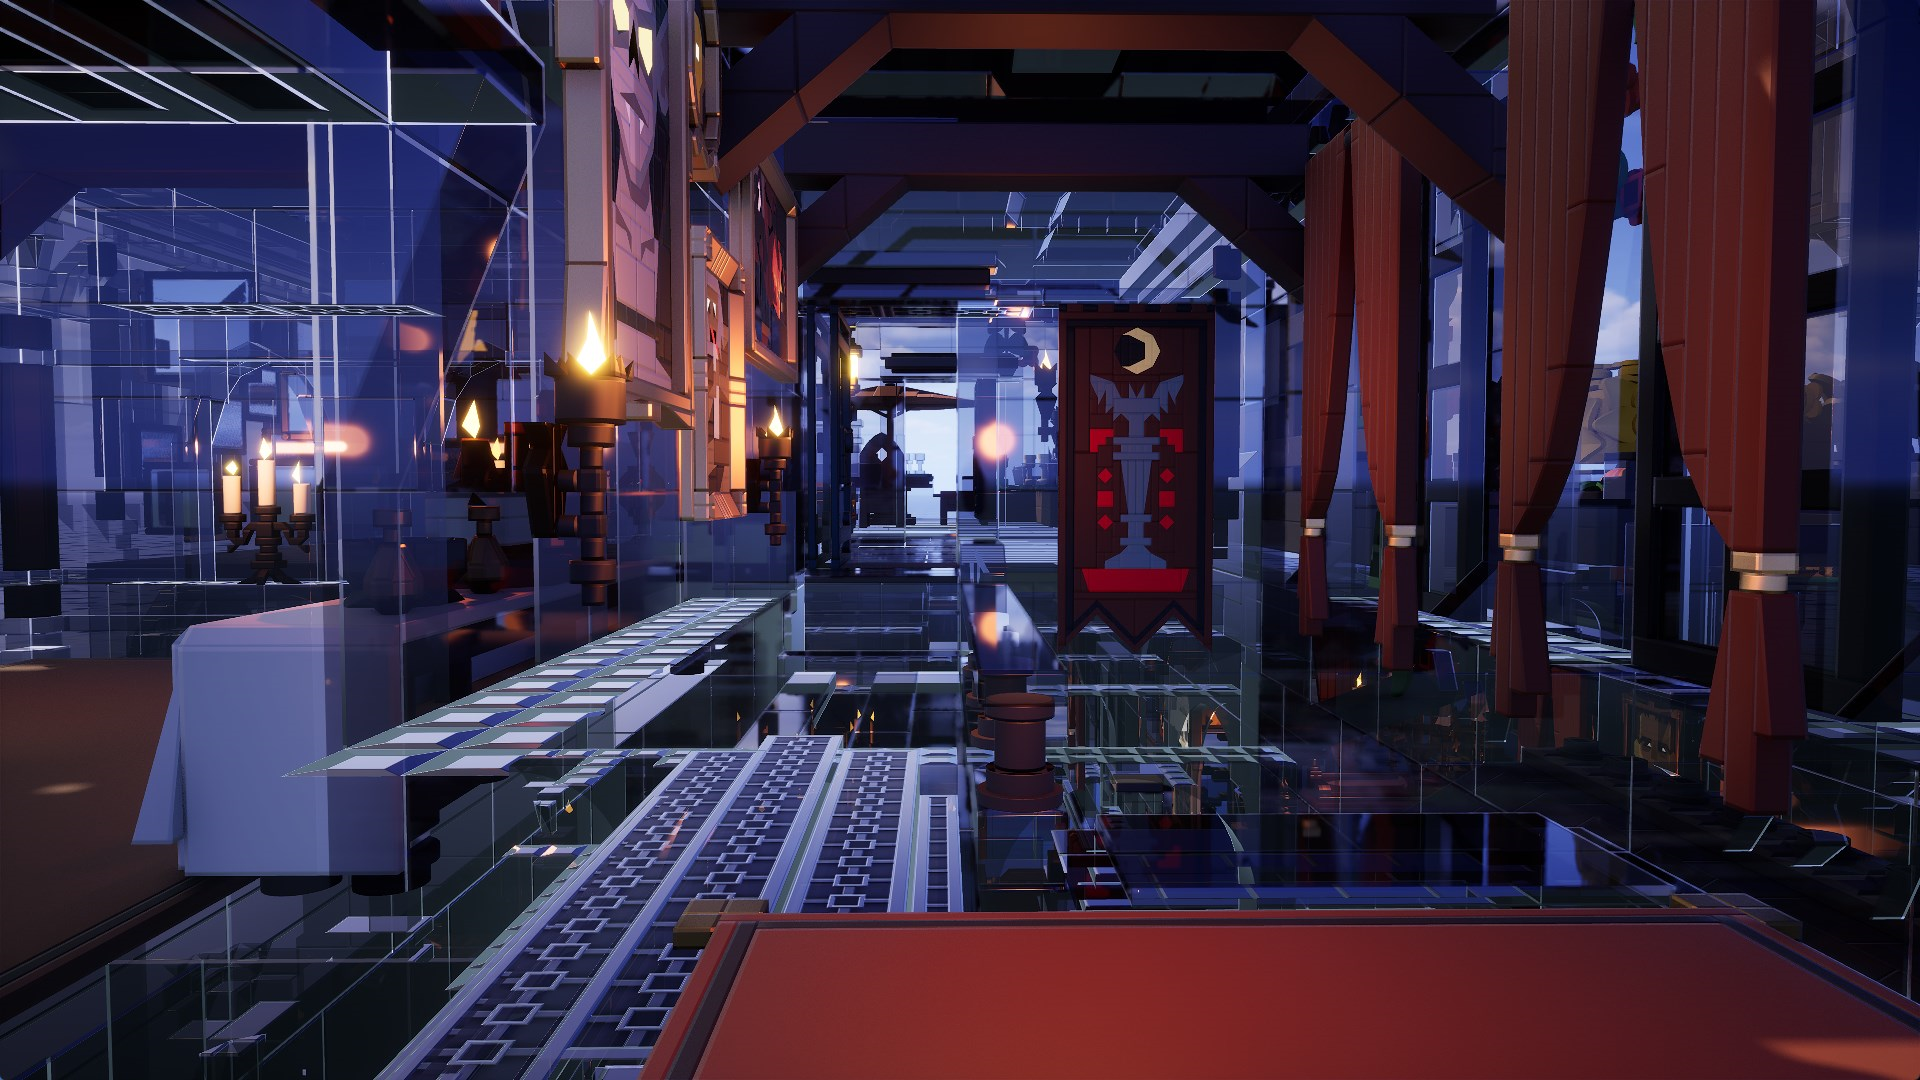
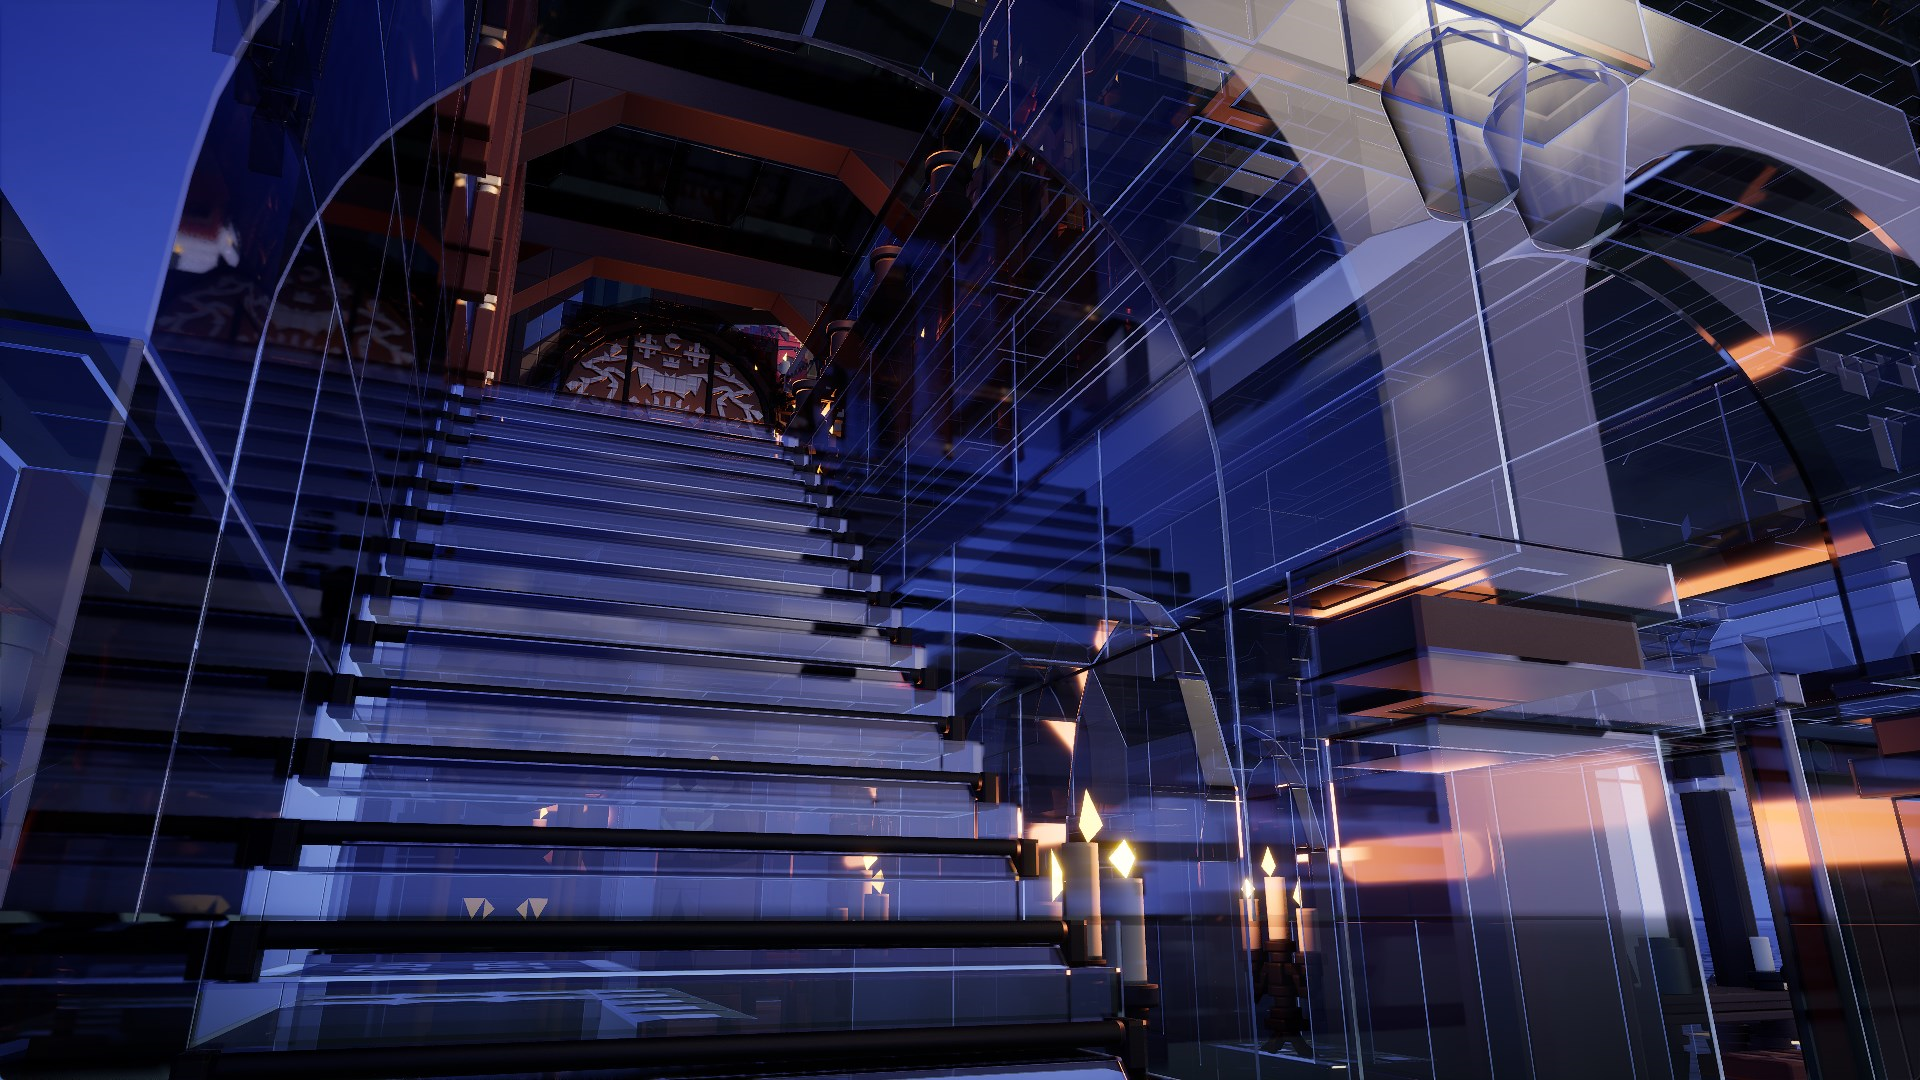
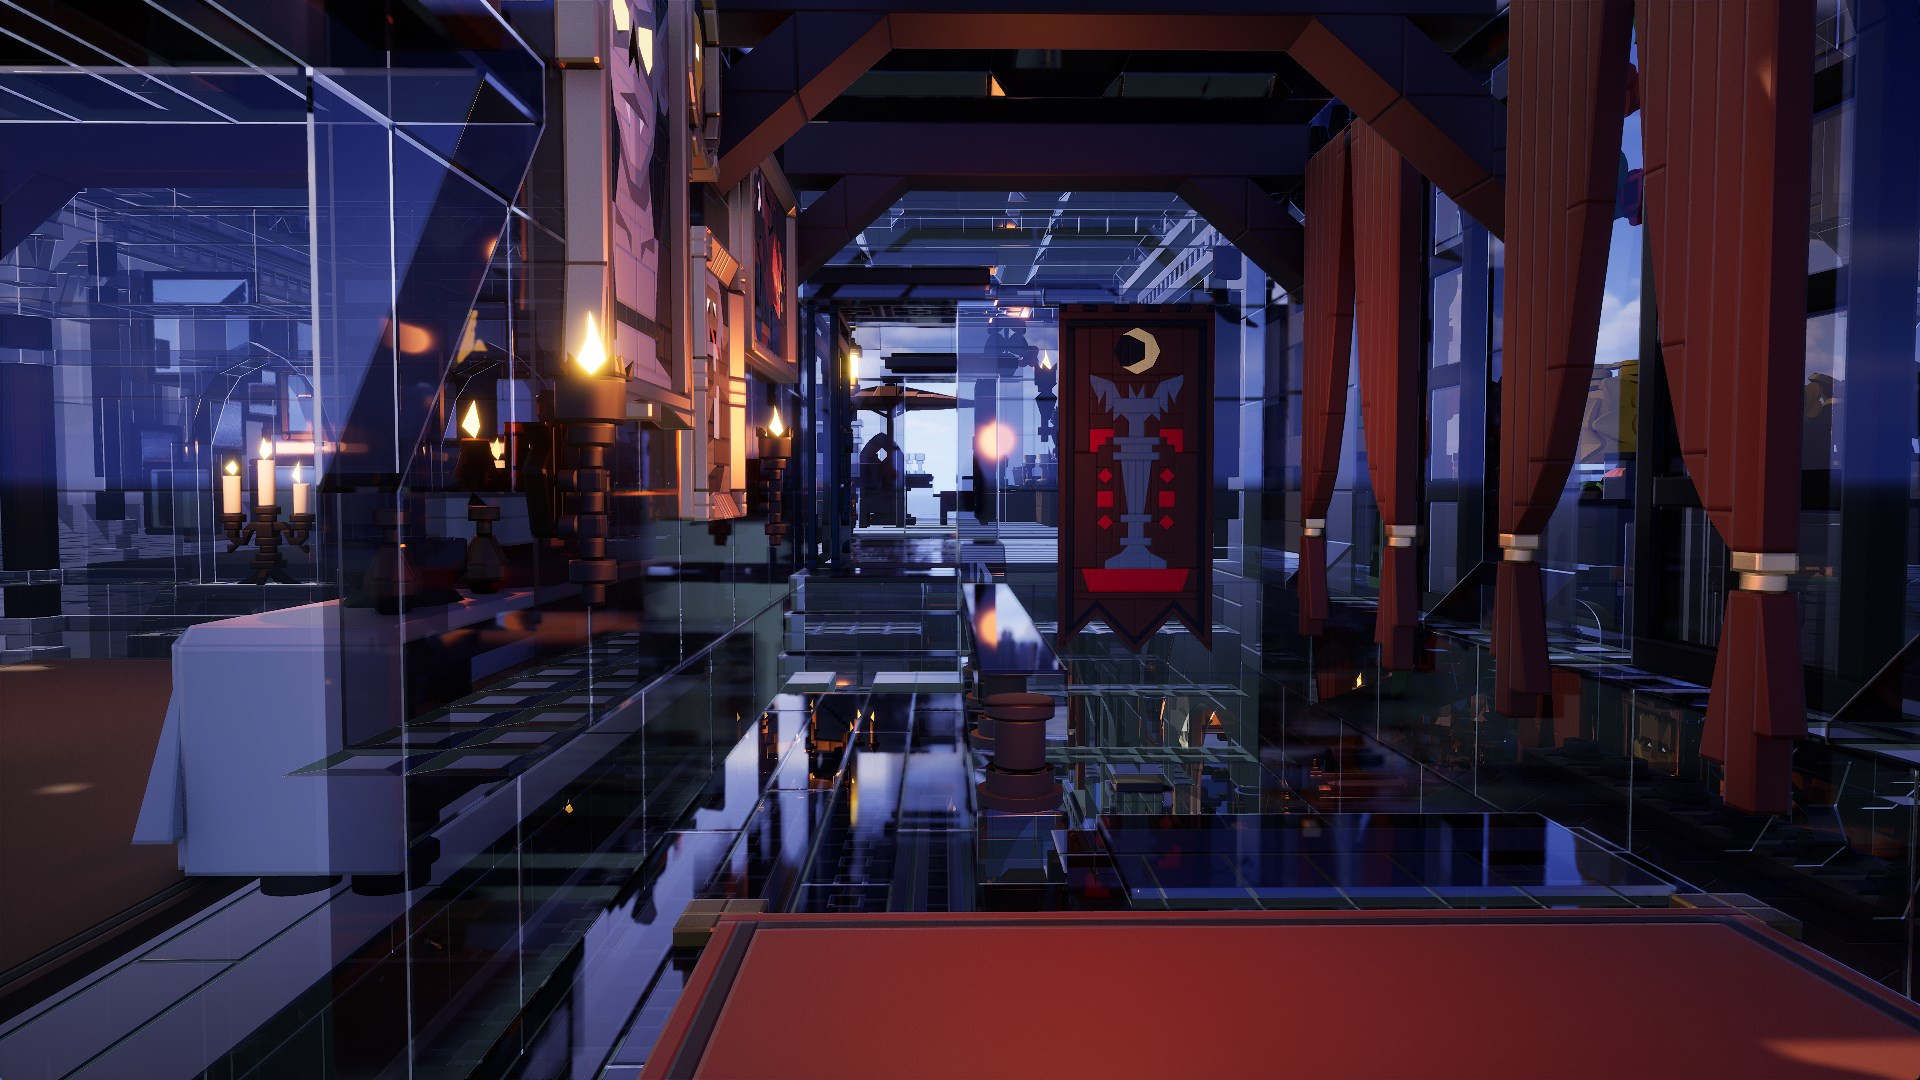
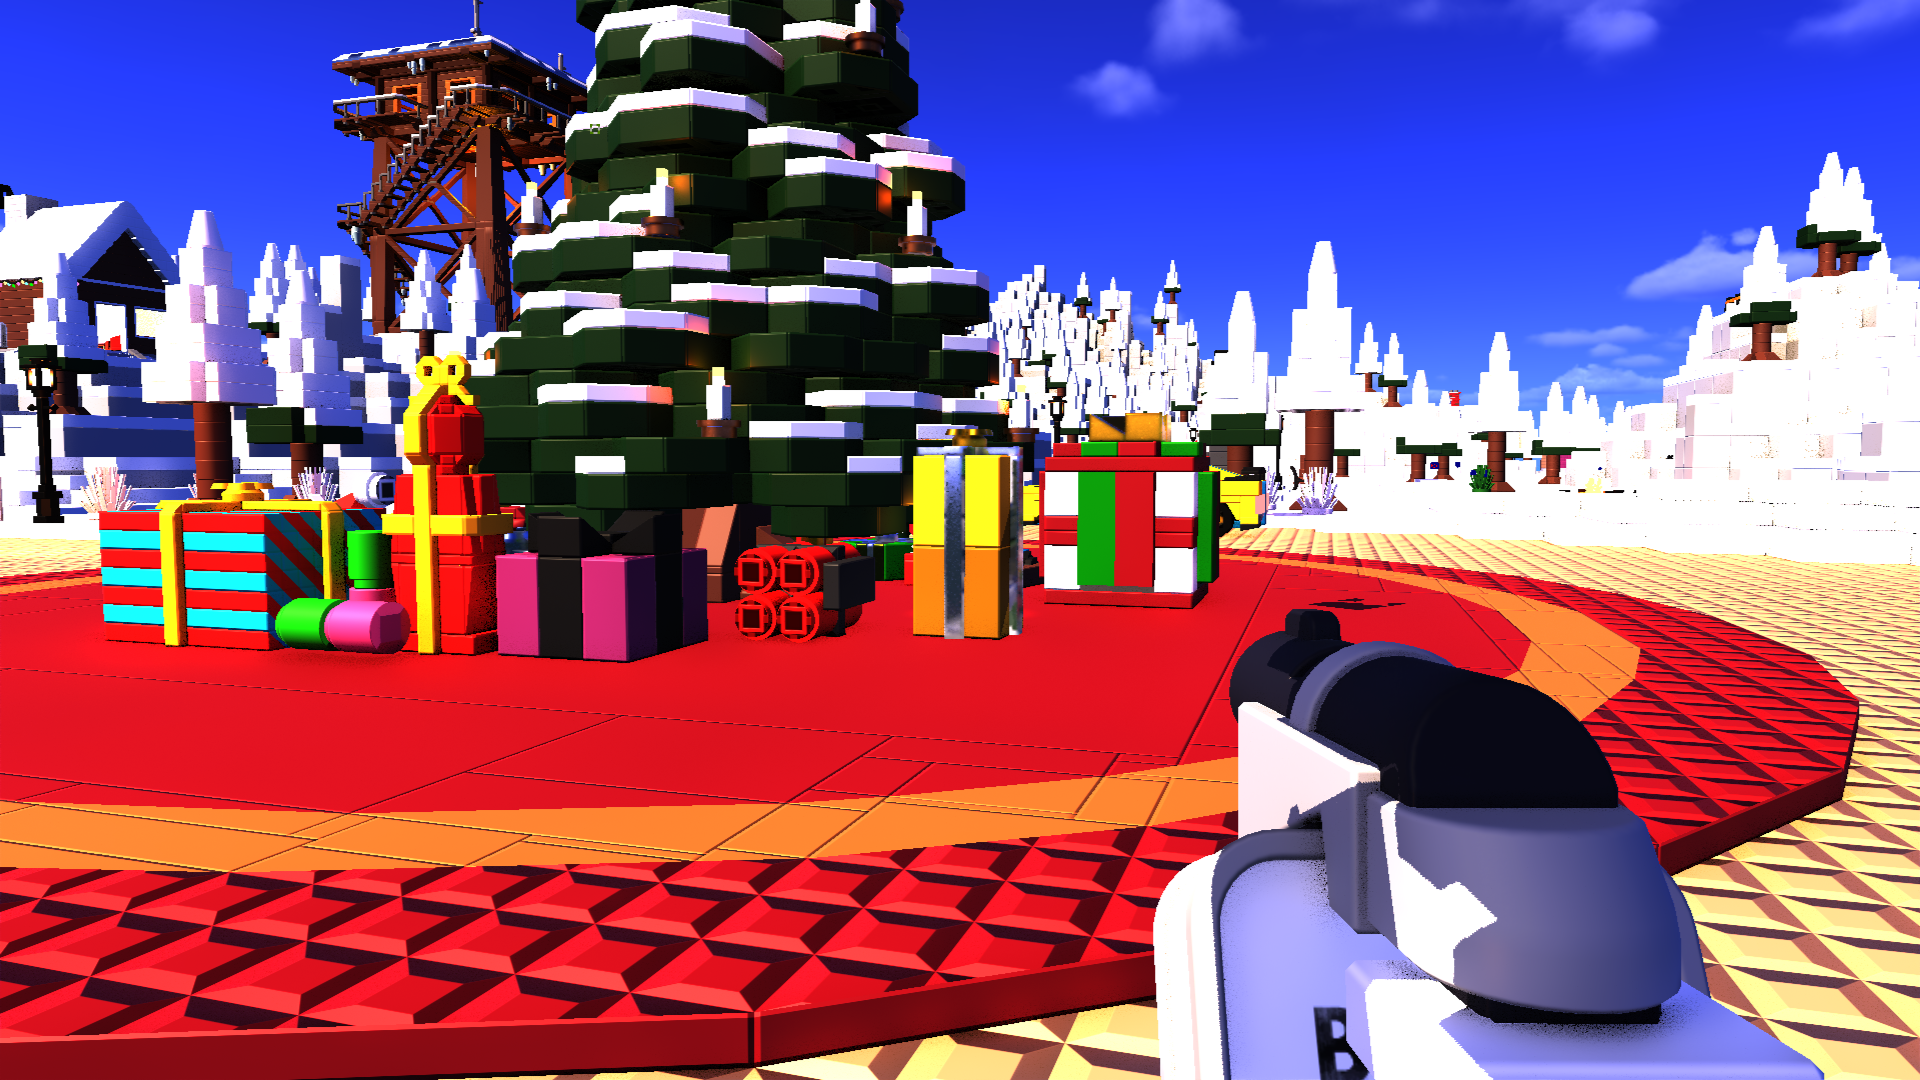
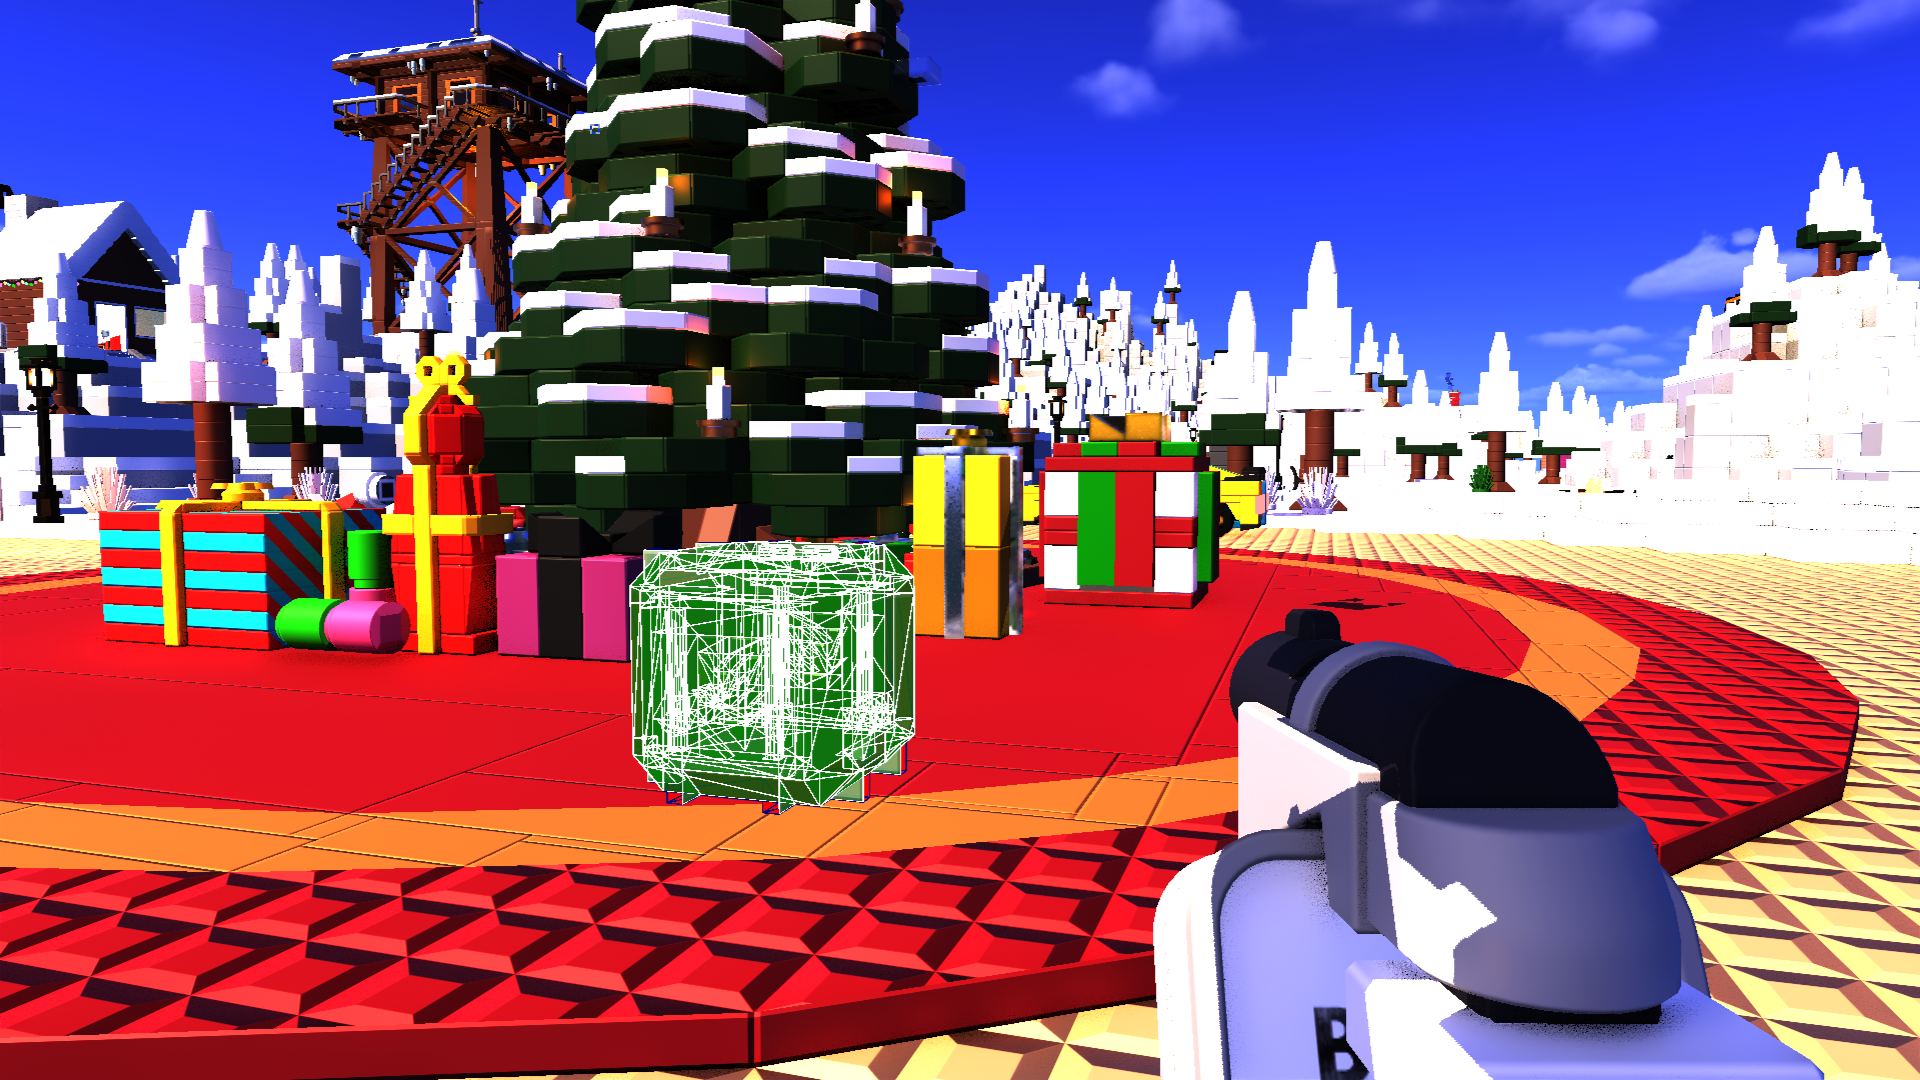
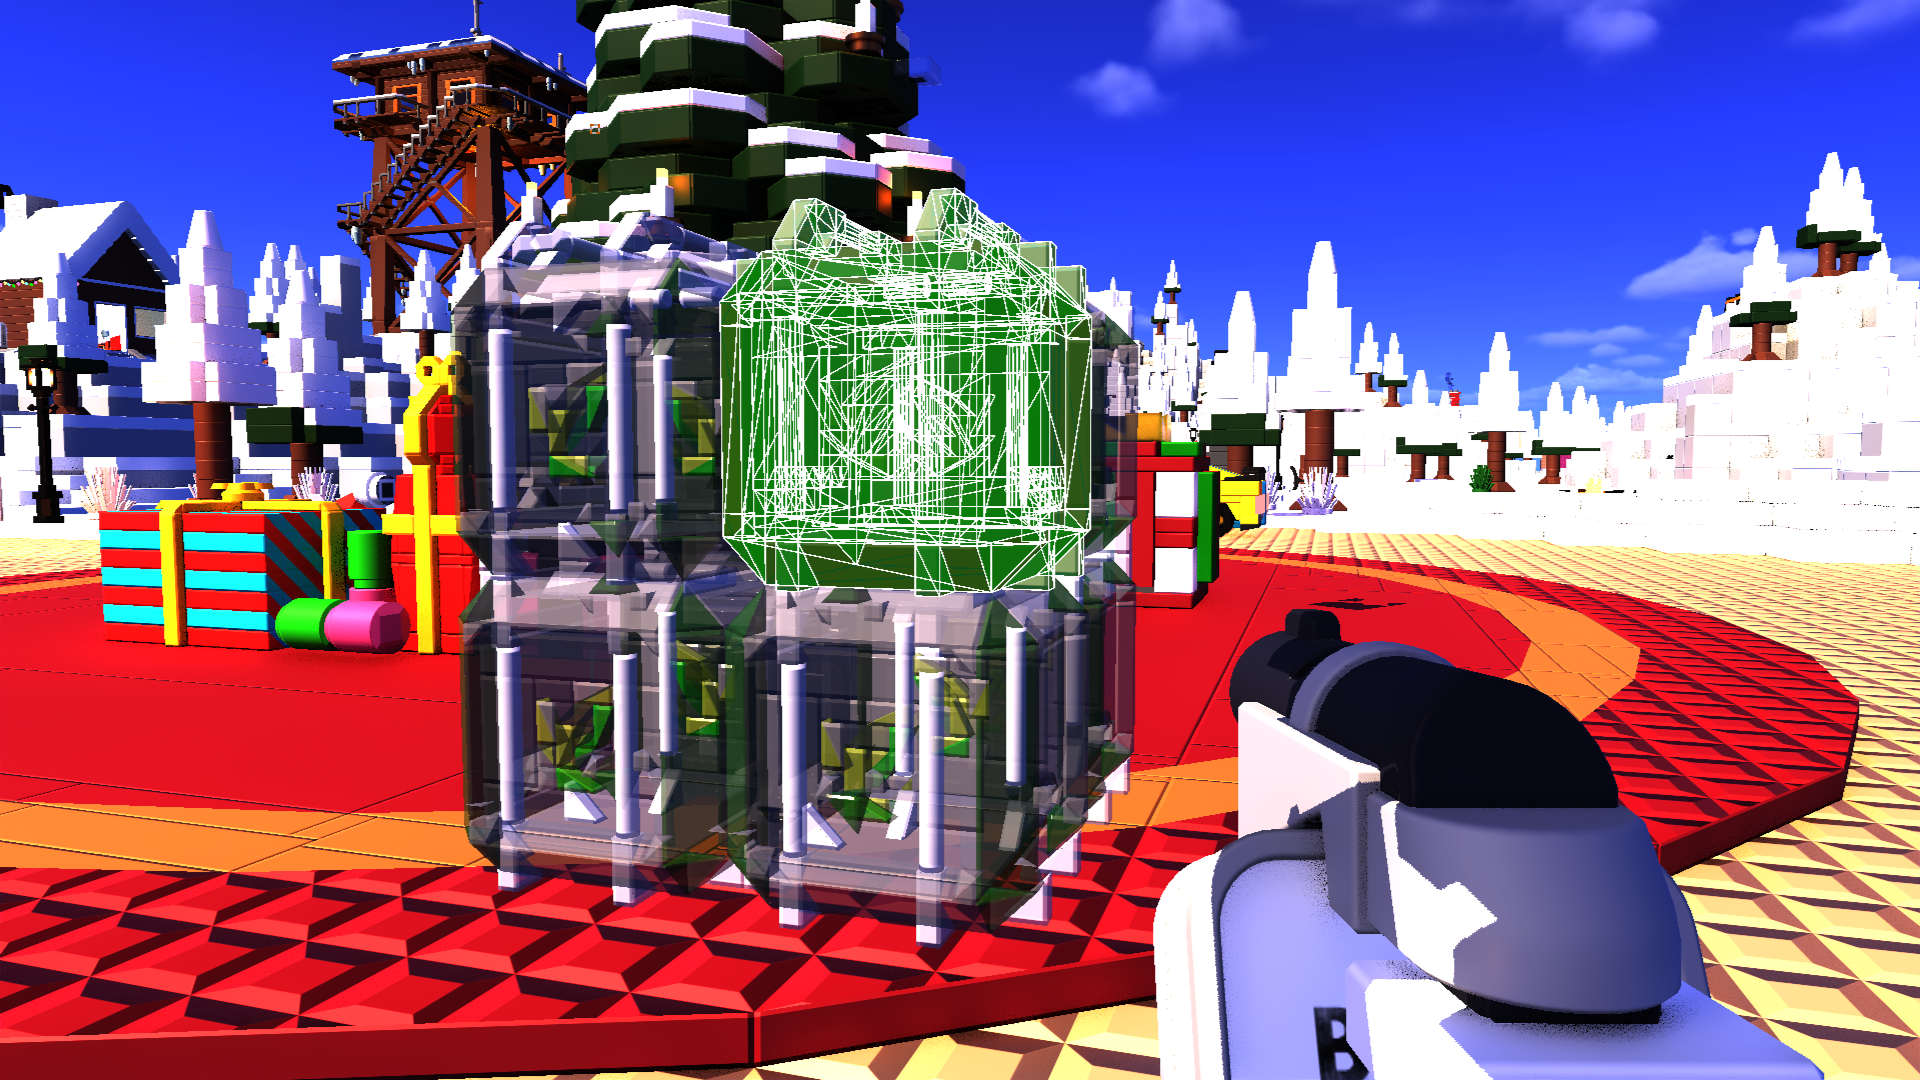
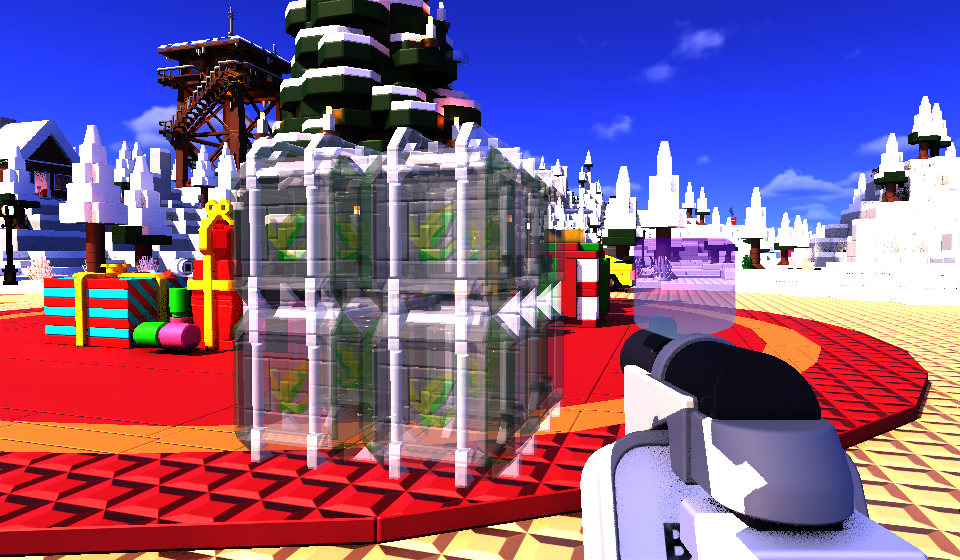
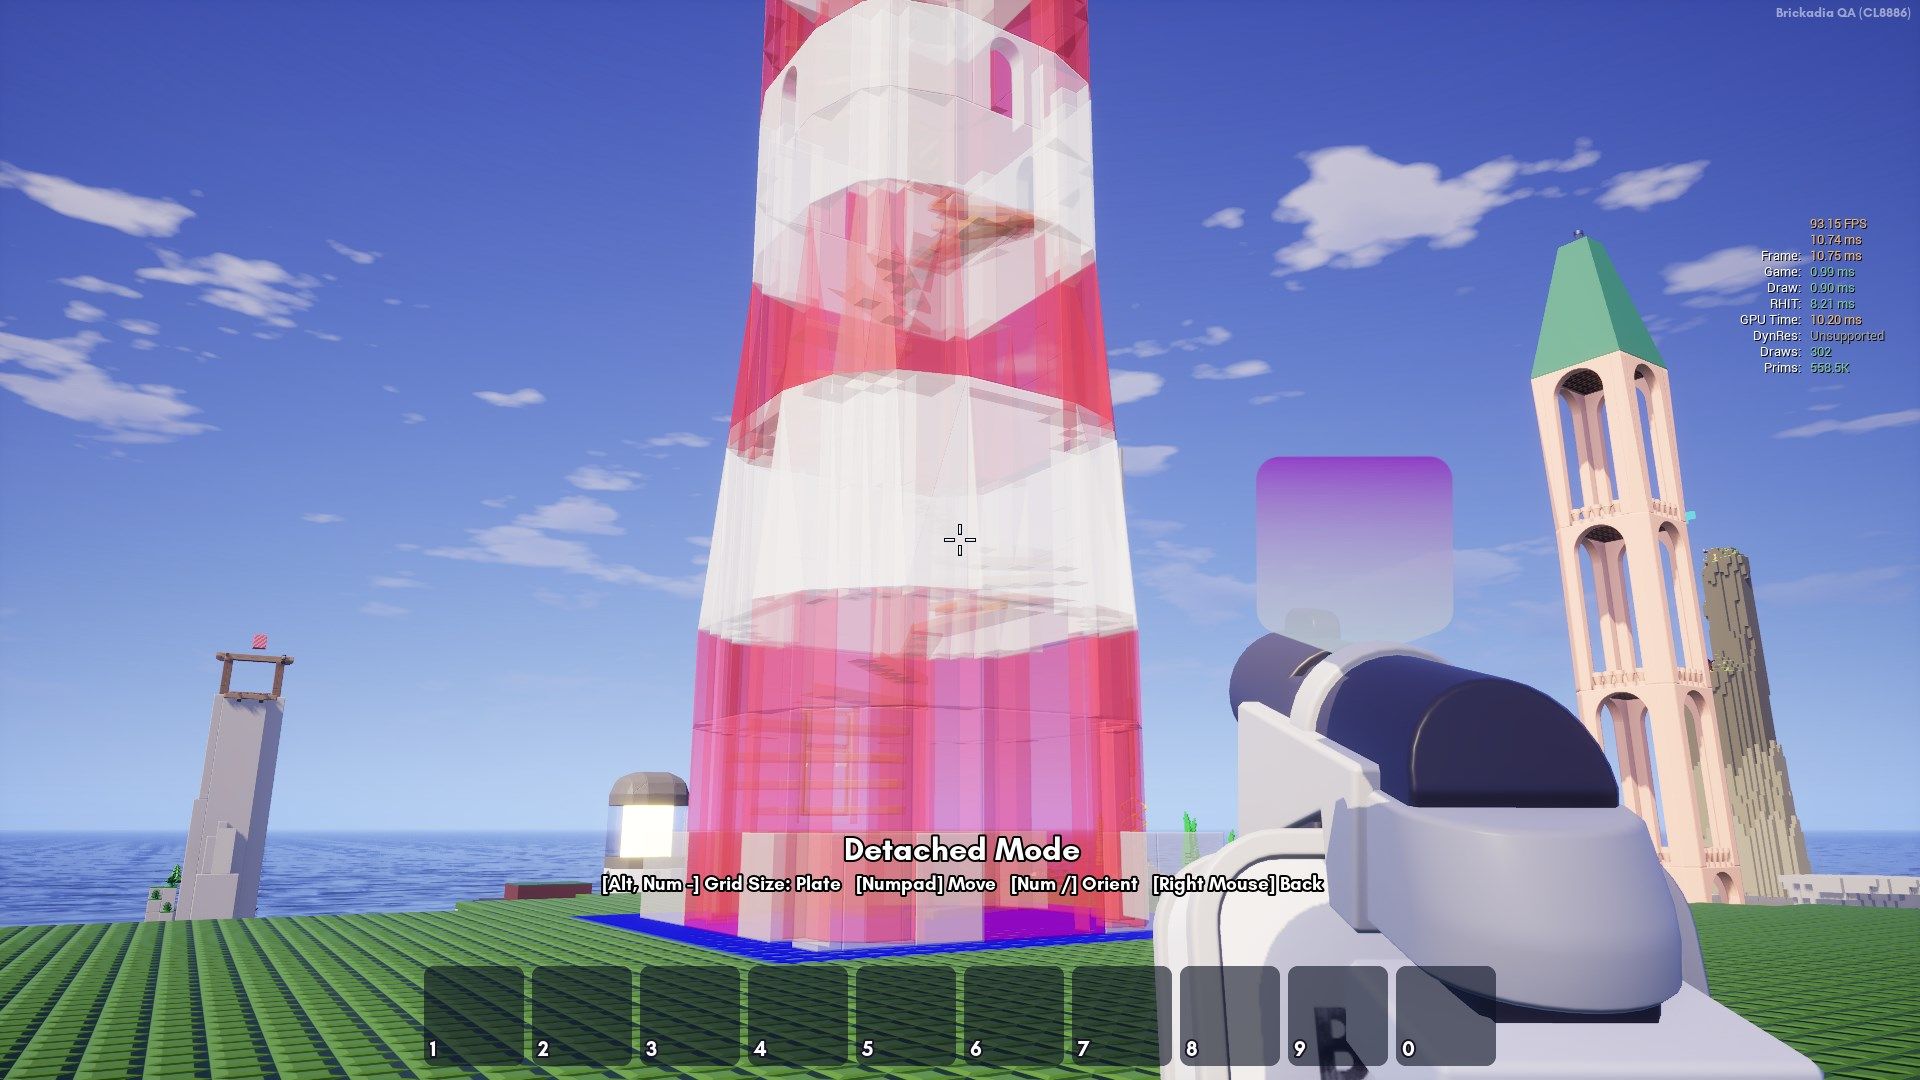
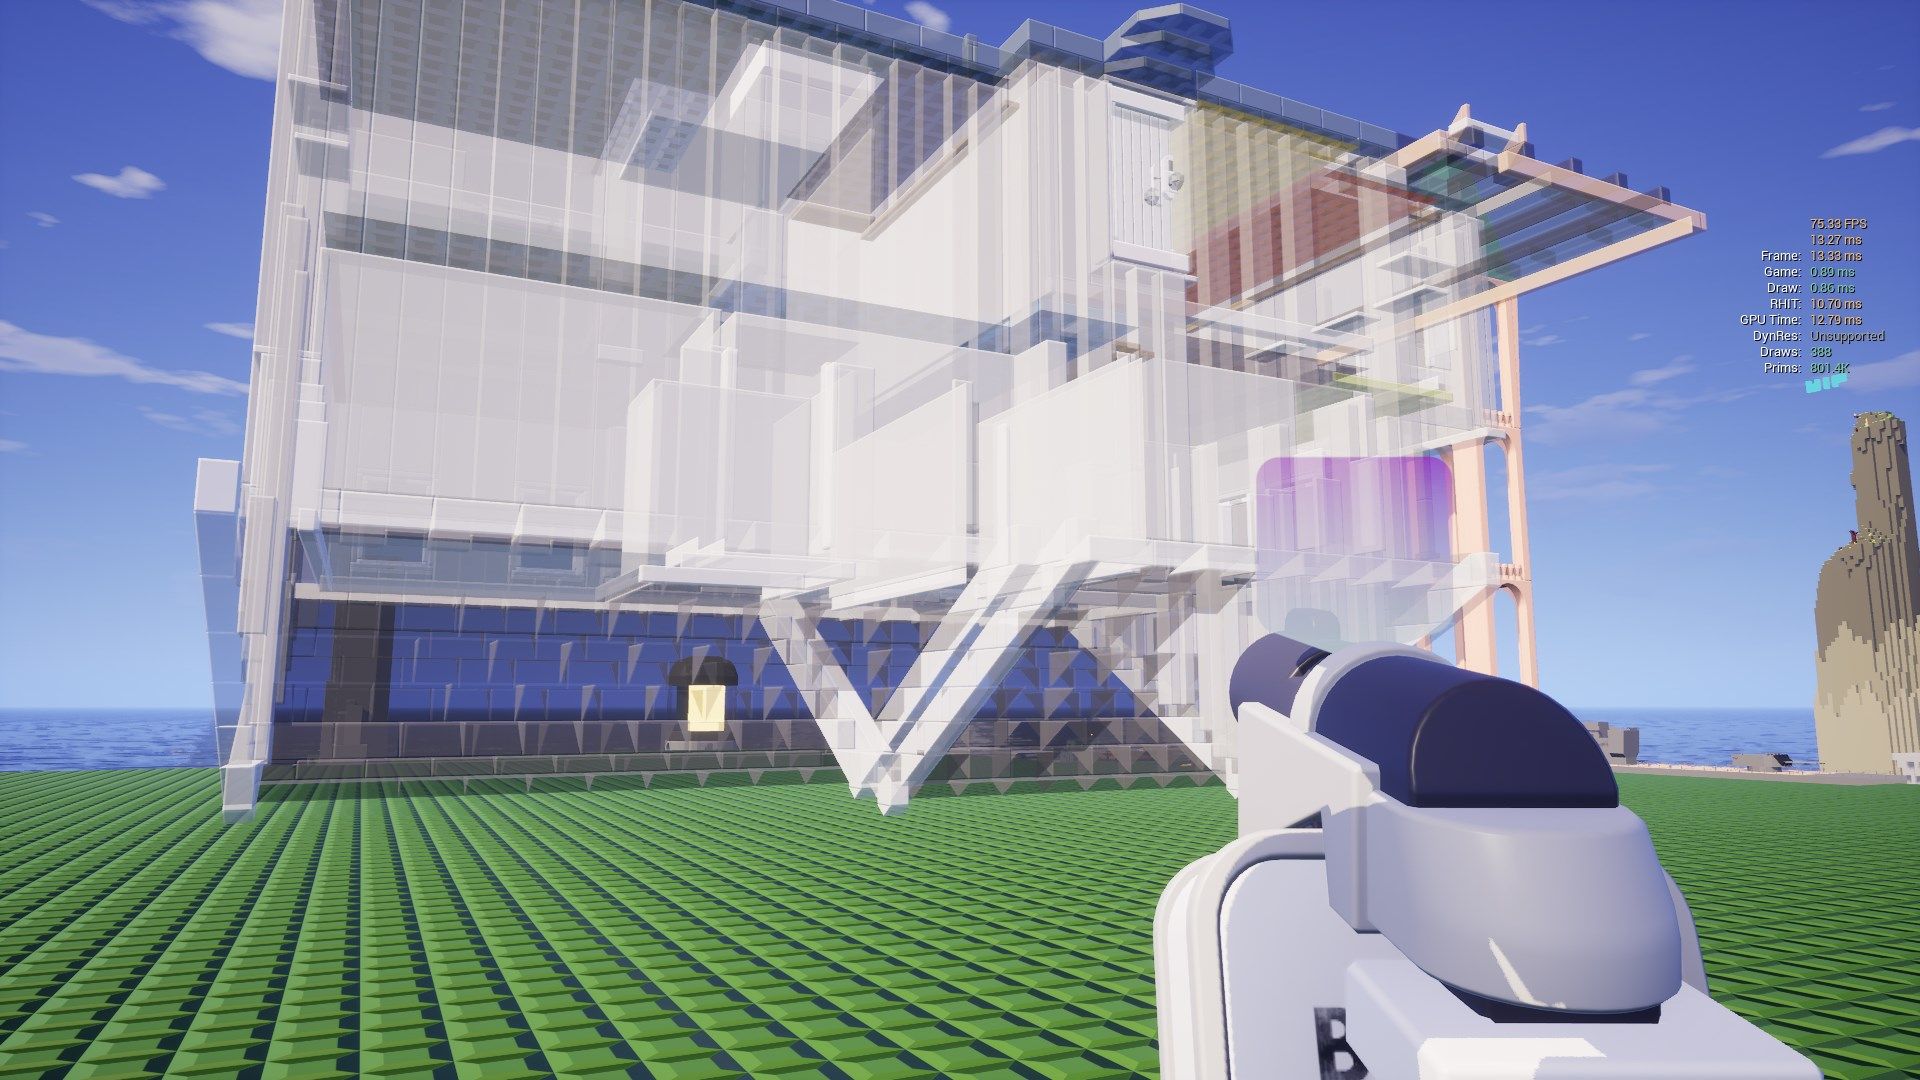
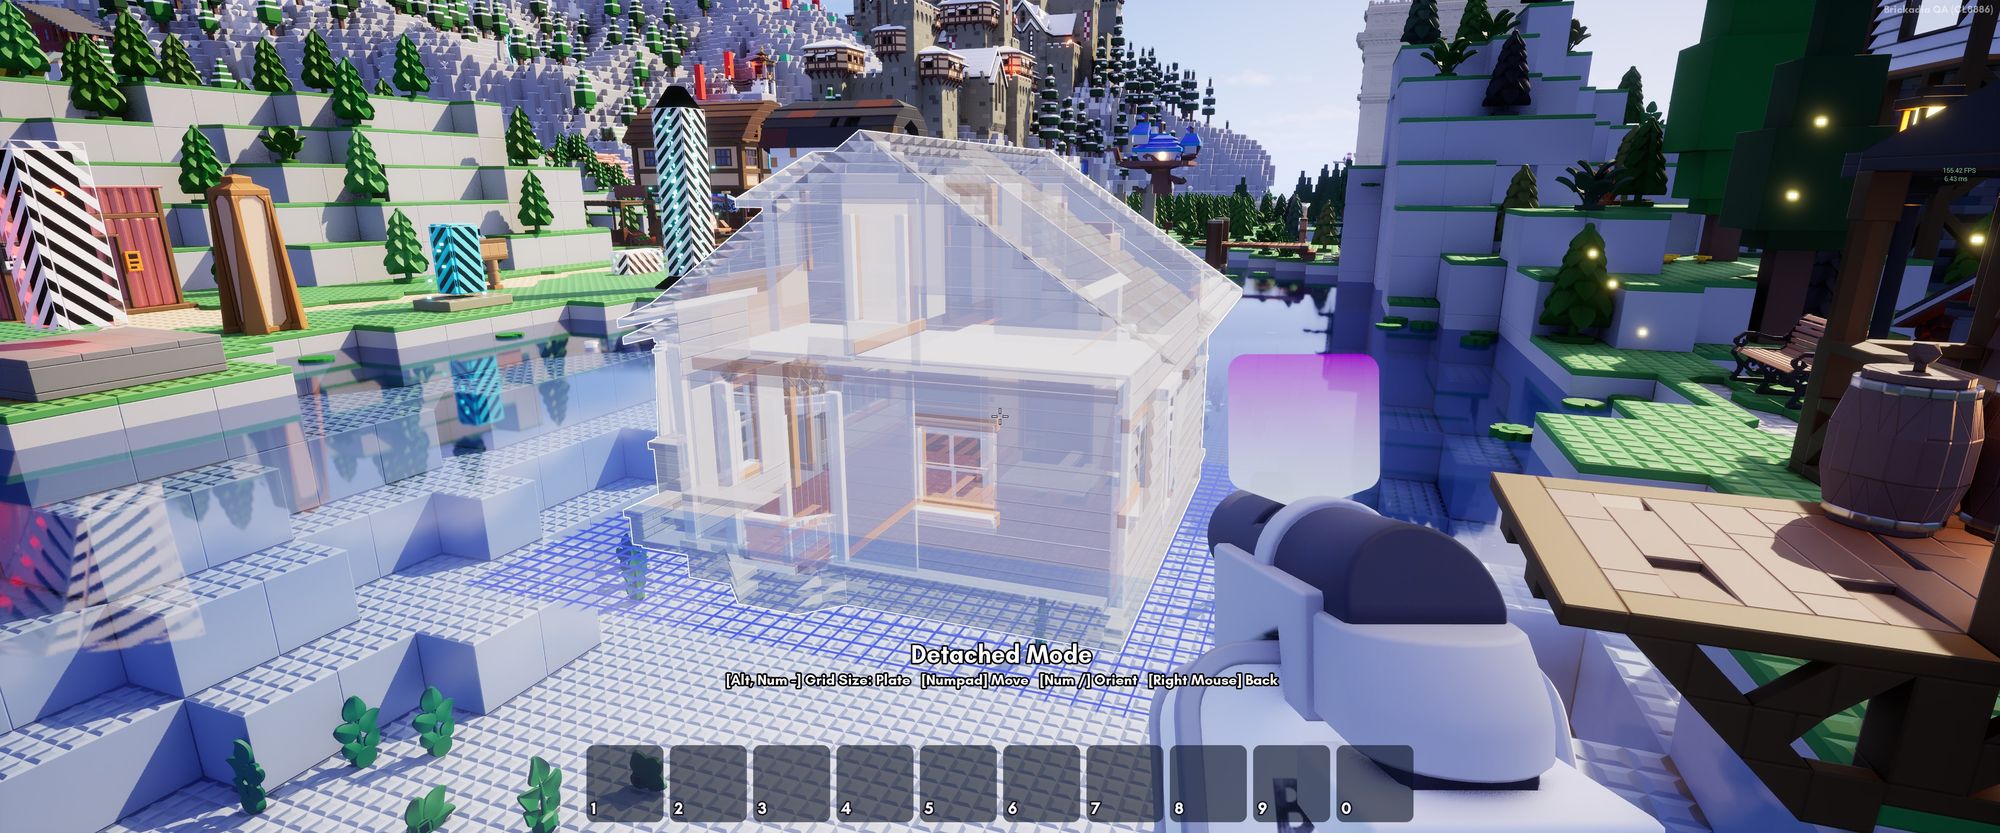
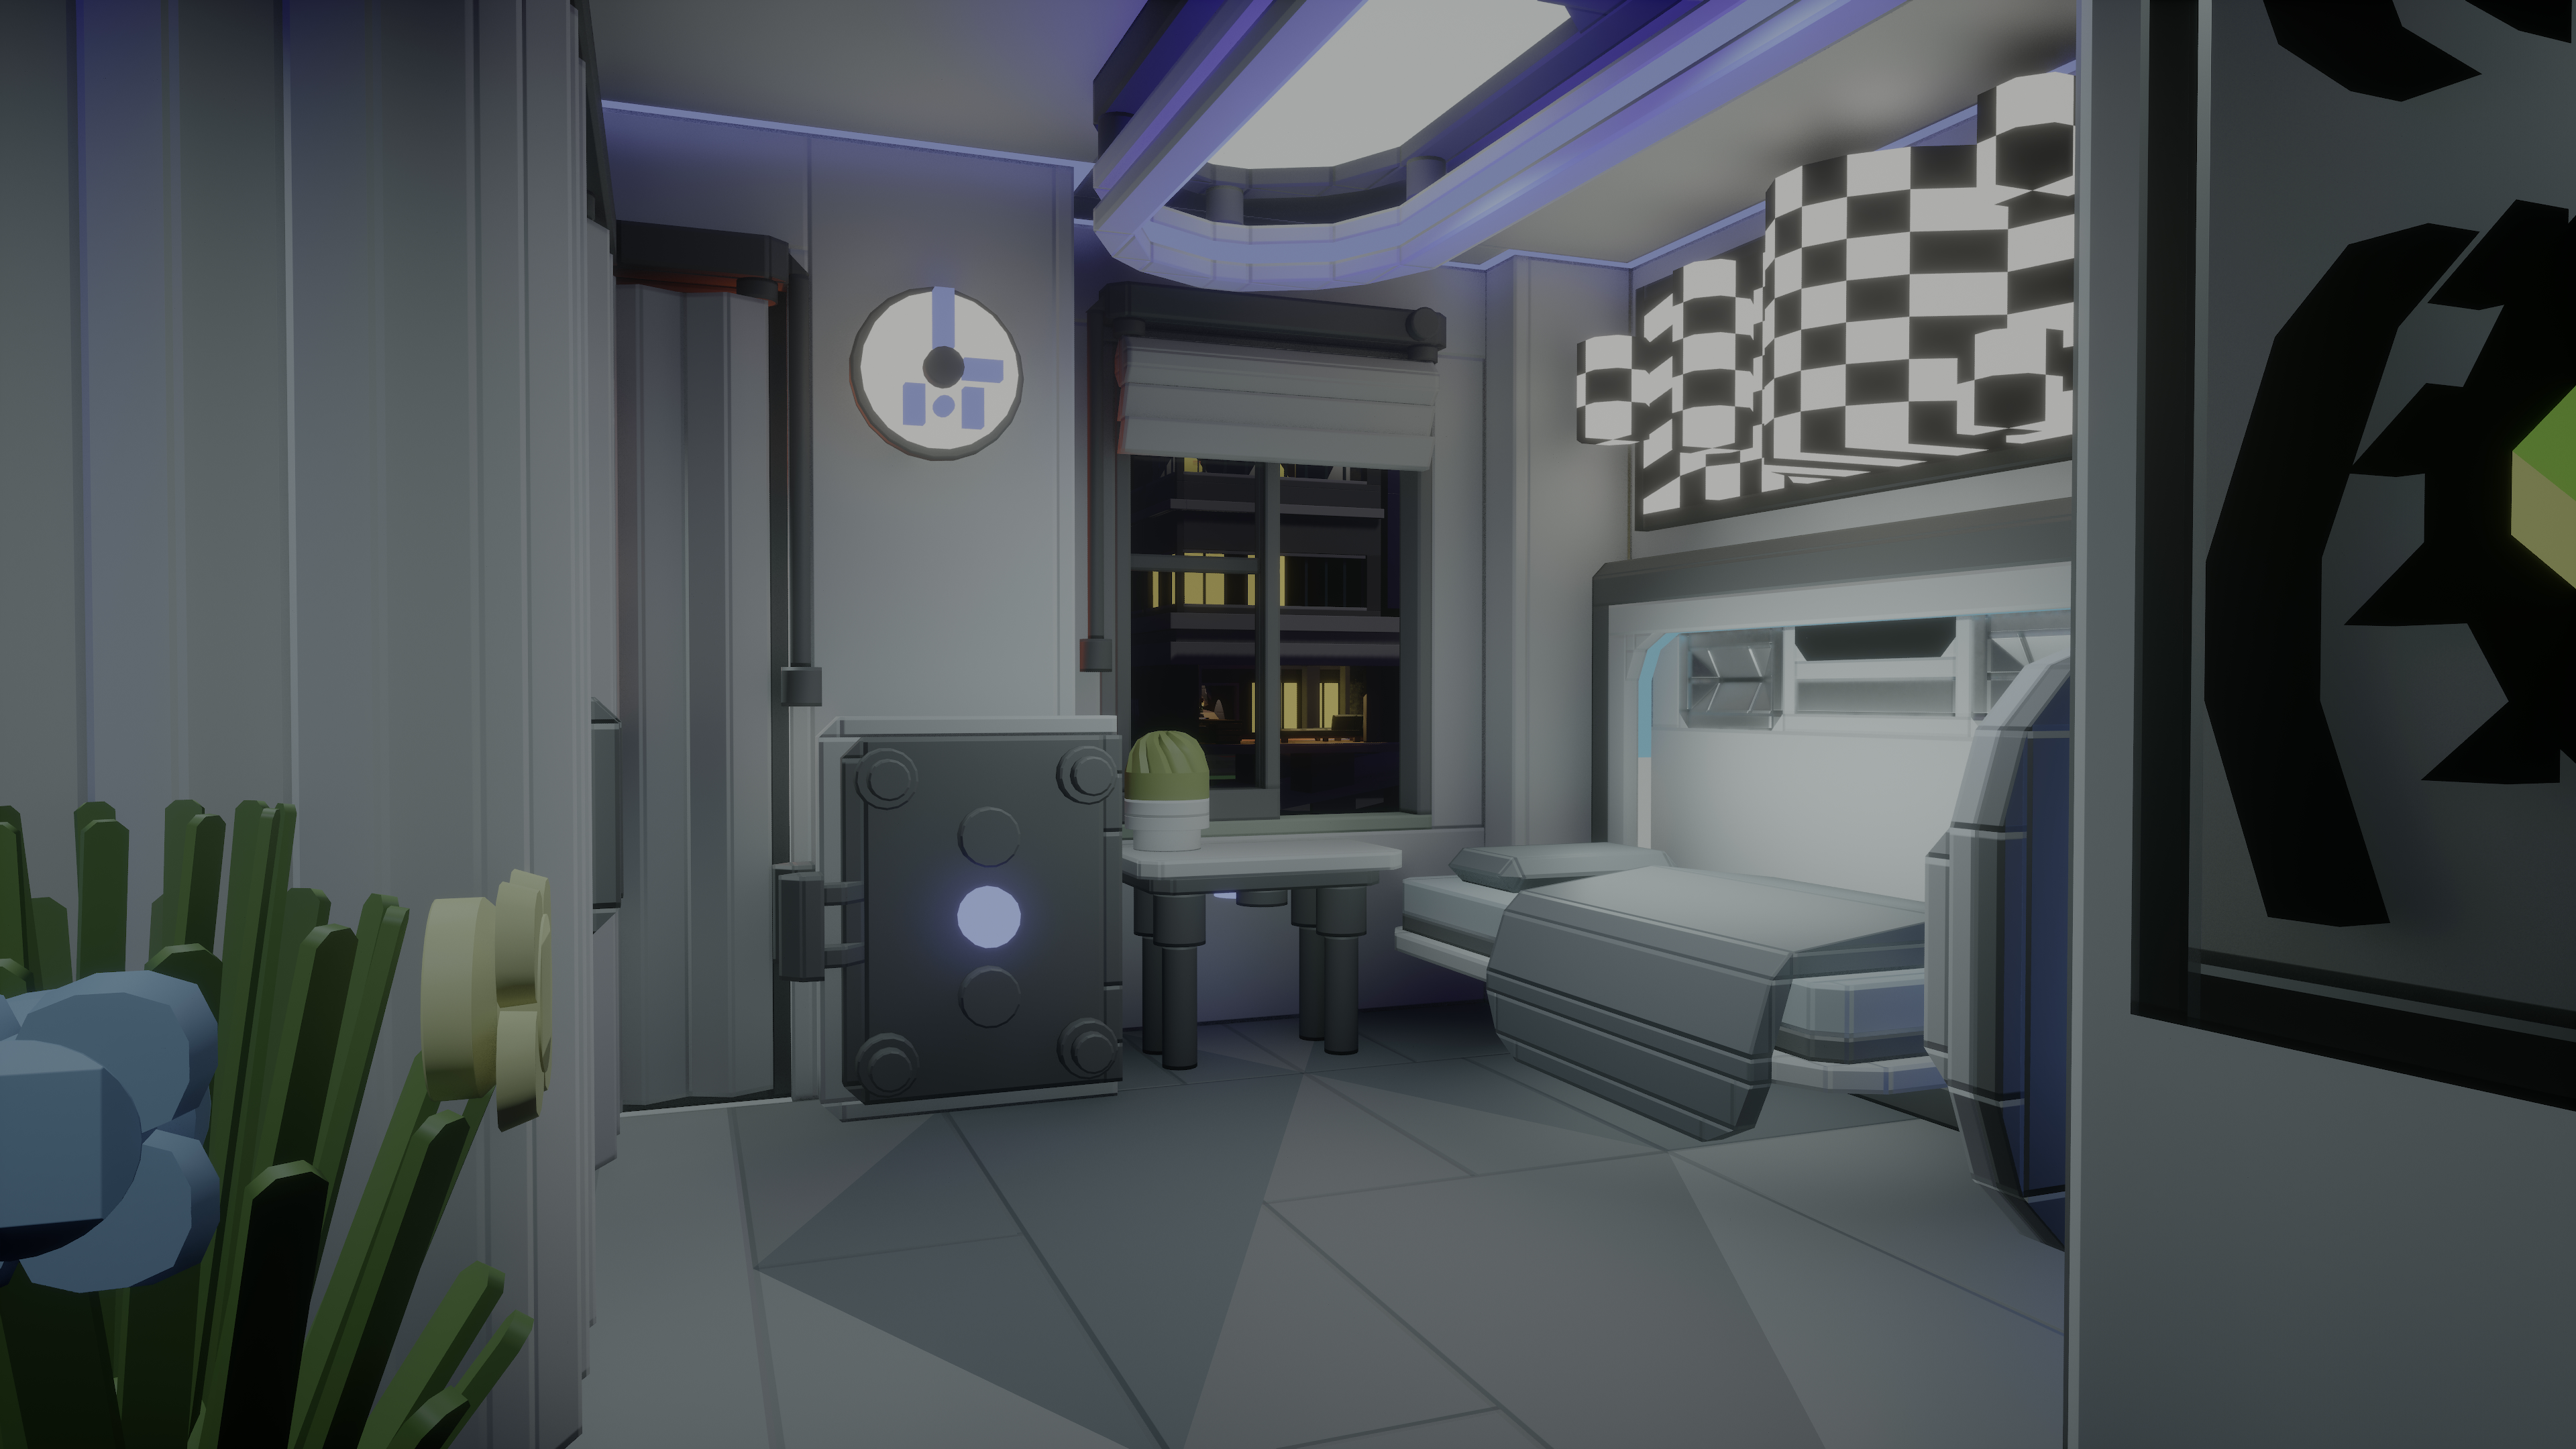
Another very jarring visual oddity in the game is the bad translucency sorting we get from the way we batch render bricks, which prevents any sorting of the inner surfaces relative to each other. So if you look at, for example, a large translucent preview of a prefab you're going to place, it will often look like nonsense.
Some examples:
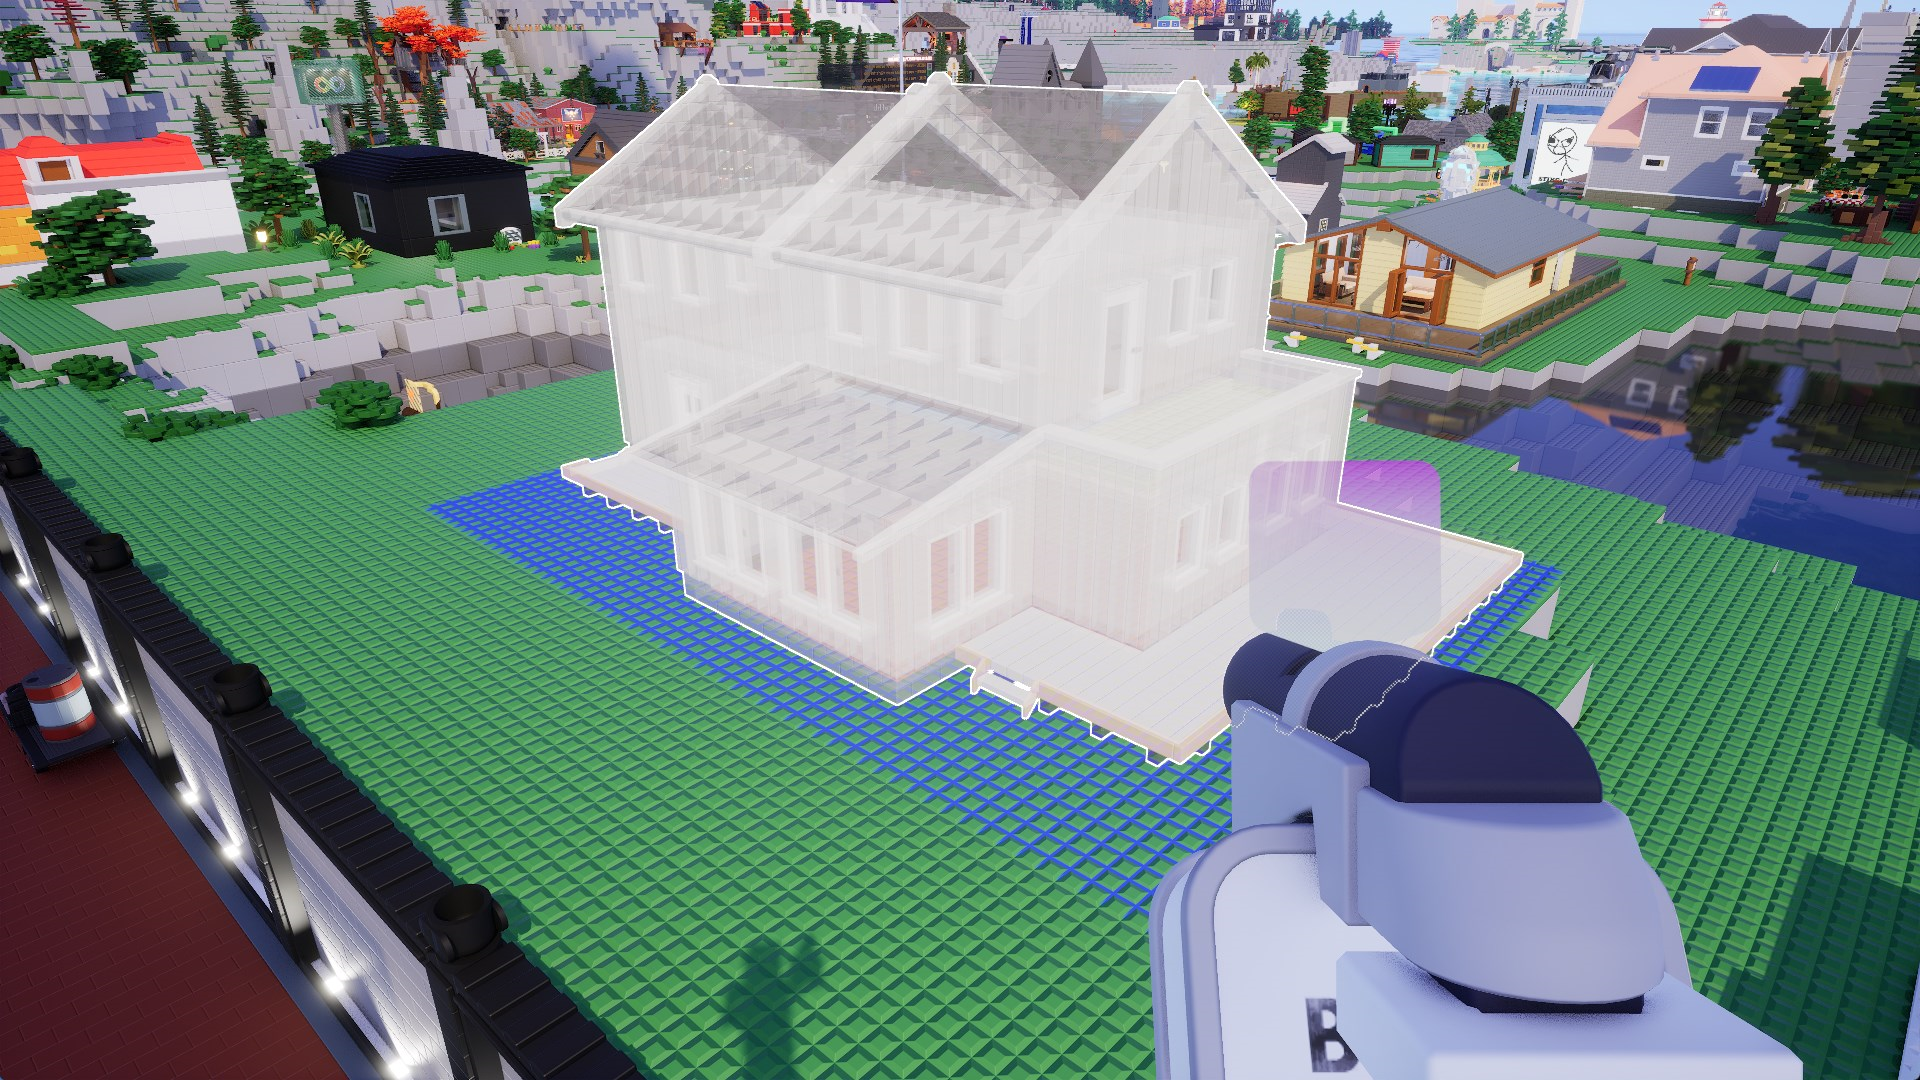
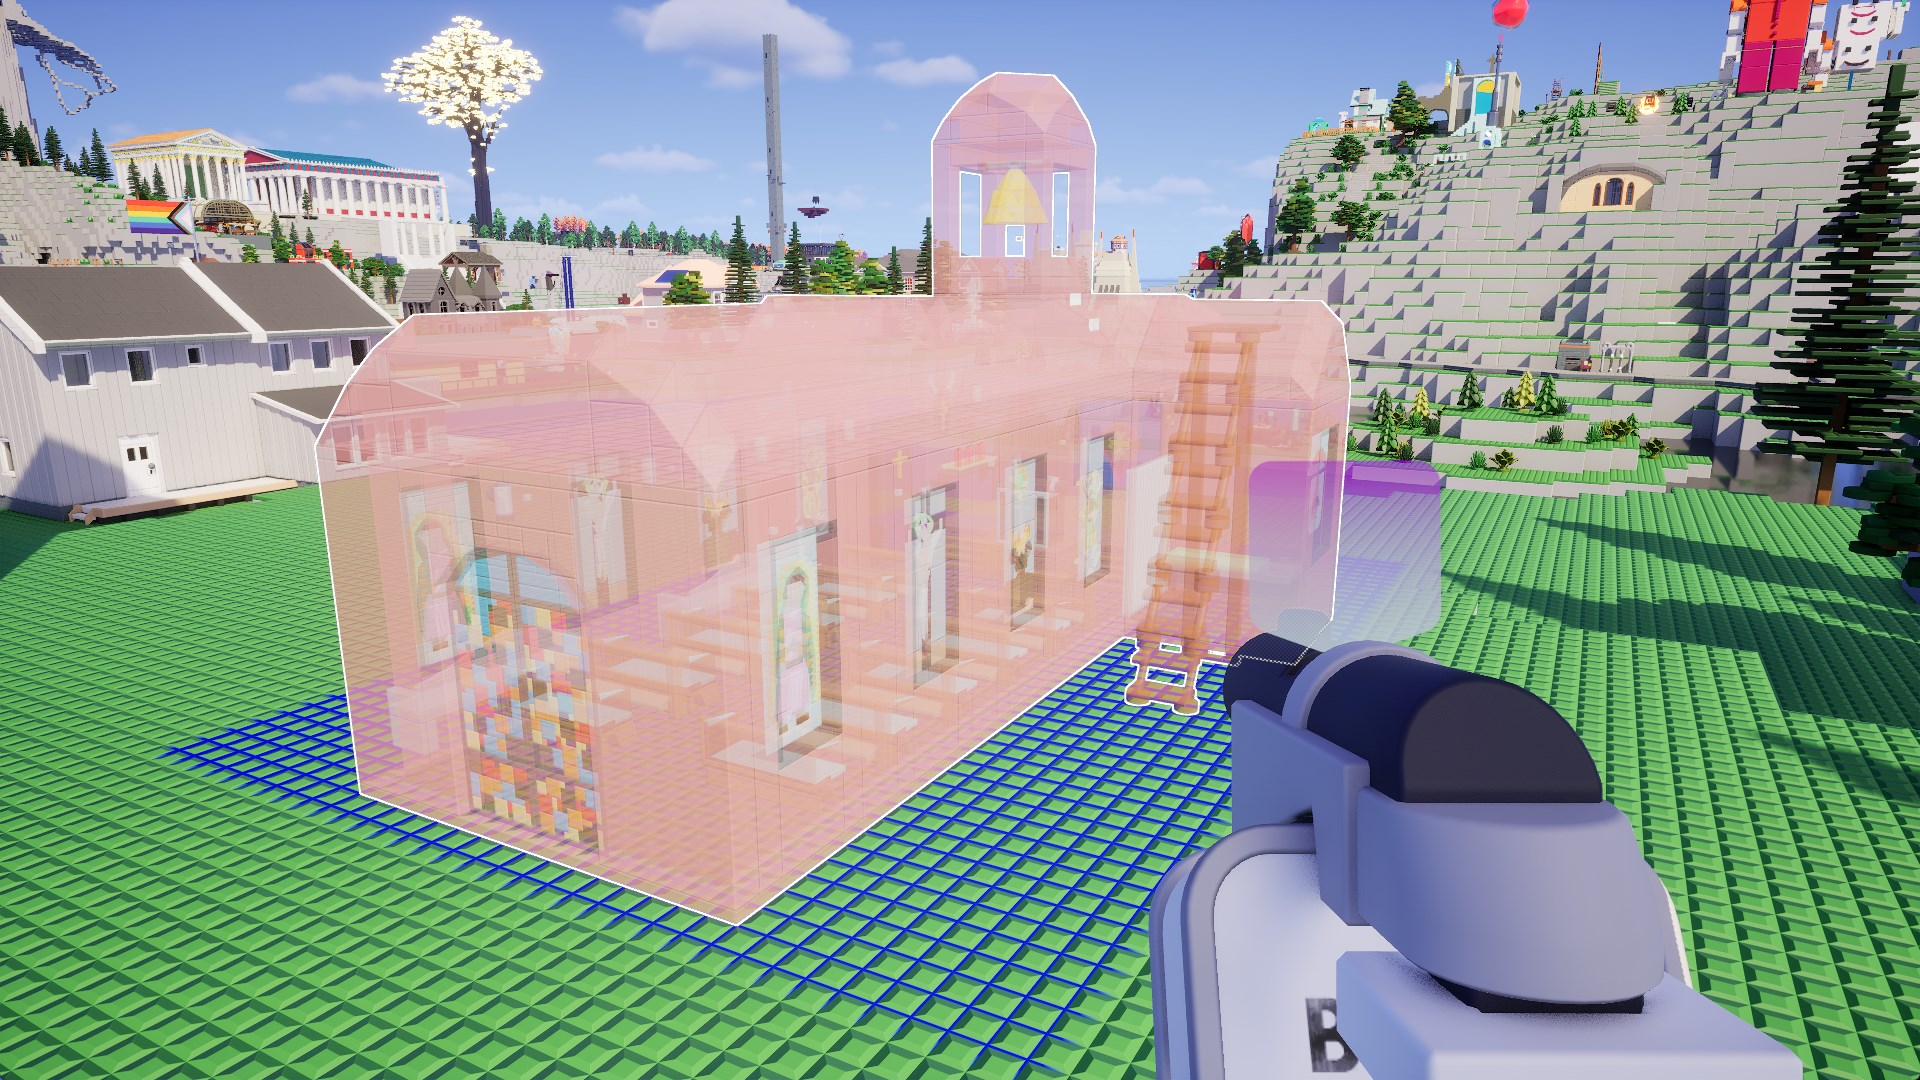
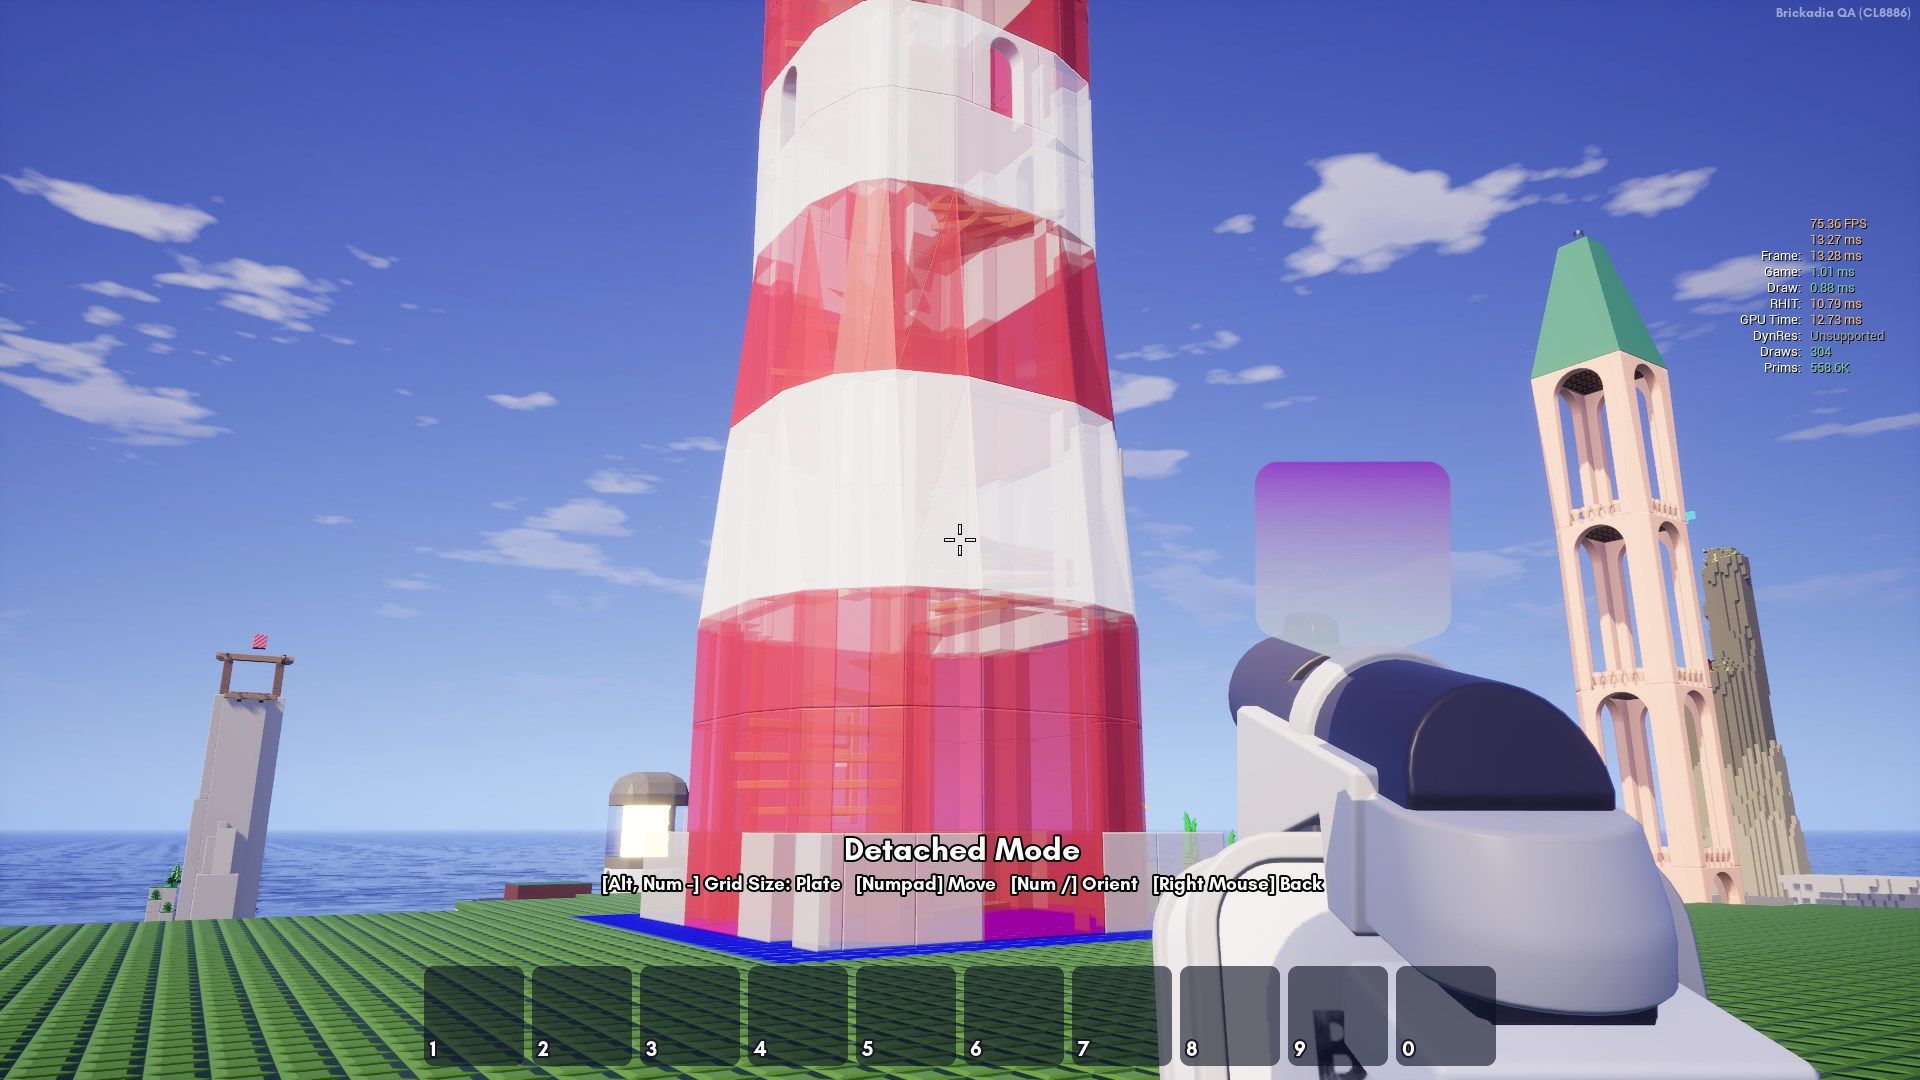
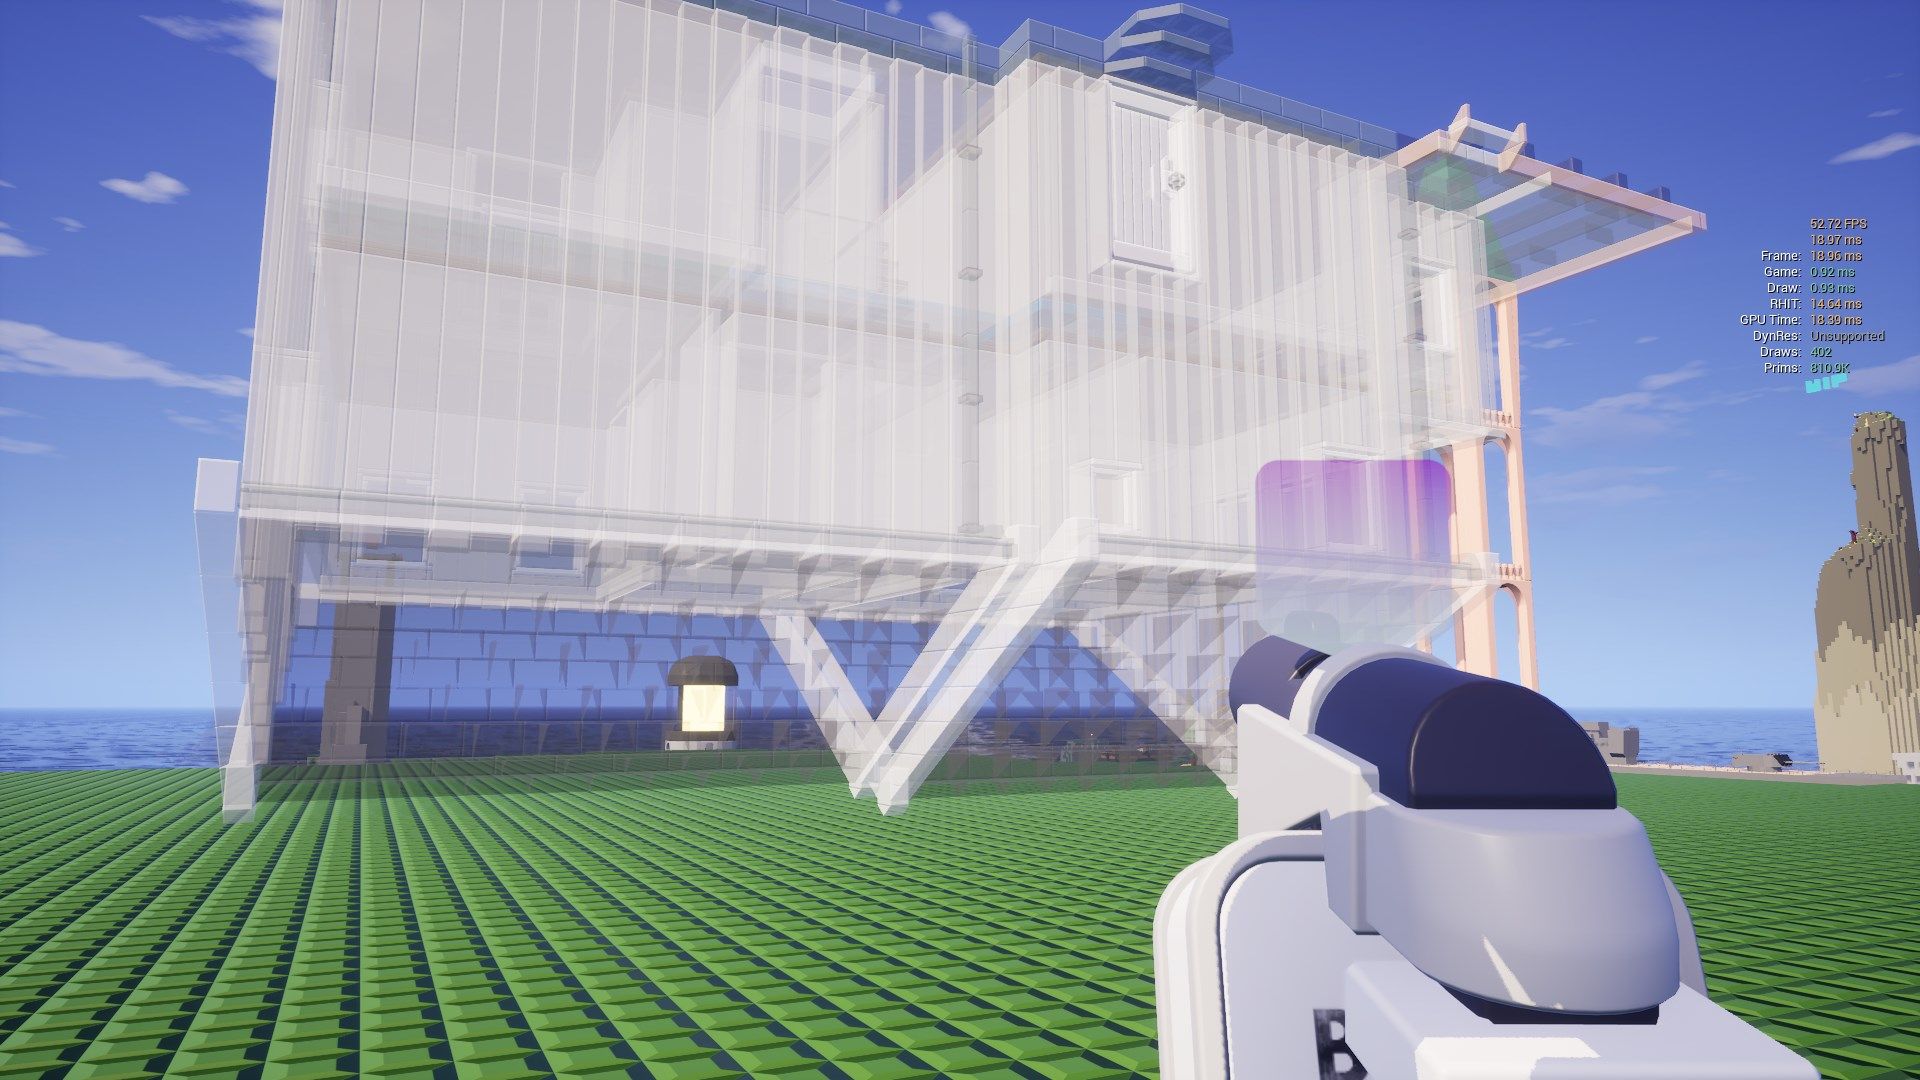
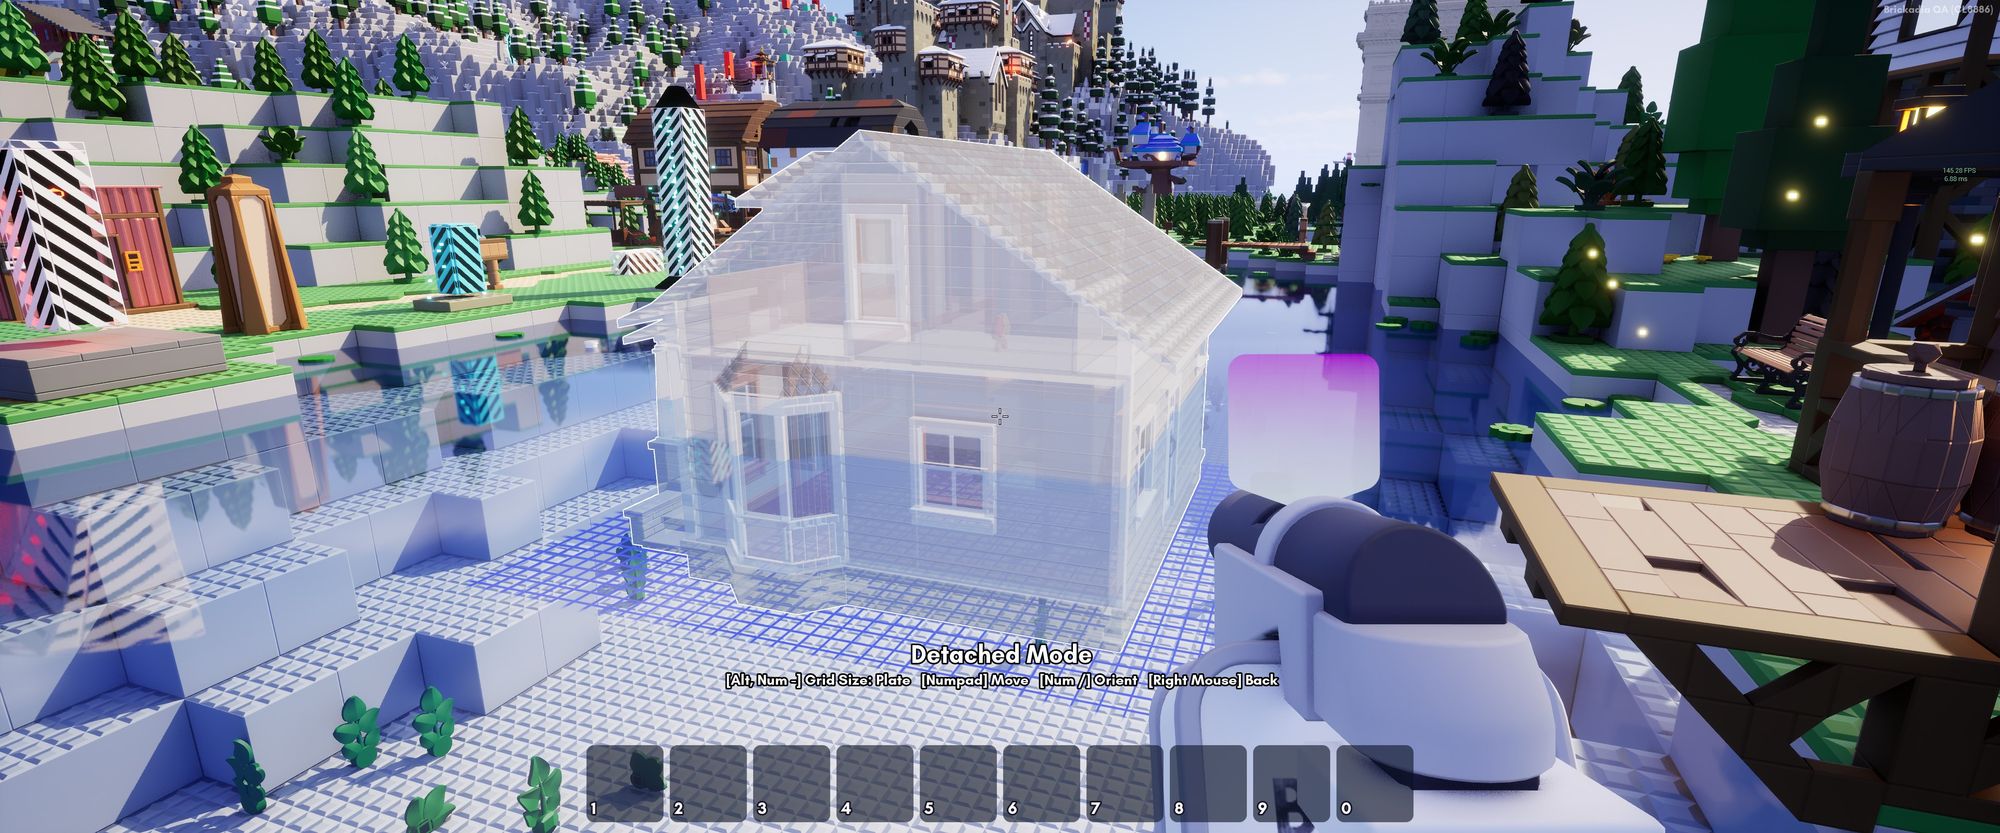
What if there was a simple way to fix it? Compare to the following images!

How Does That Work?
Unreal Engine implements a technique called Multi Layer Alpha Blending (MLAB). There is a nice blog post here that goes into more detail on how such a thing could be implemented when you're not dealing with the massive engine shaders. The implementation in Unreal Engine is more efficient though, we'll get to that later on.
At a high level view, what the engine does is use a large buffer to store up to N translucent surface layers for each pixel, sorted by their depth. Every time a new layer is rendered to that pixel, we insert it into this buffer at the correct index, potentially merging the last layers if the buffer is full. Then after all objects were rendered, we flatten the layers to a single color.
To compare, let's first look how Unreal Engine traditionally rendered translucent objects in the world. We will take a look at the following scene.
Before rendering any translucency, the opaque scene is drawn and lit.
Then we start drawing the translucent objects on top of the scene with forward shading. The engine tries to sort objects by their distance from the camera here, so nearest objects are drawn last. This doesn't work as intended for our bricks, because we can't draw tens of thousands of translucent bricks as individual objects. Instead they'll be rendered in large clusters, which means most of them remain unsorted.
With the translucent faces drawing arbitrarily over each other inside each cluster, performance is very good, but the result is very bad looking with wrongly sorted surfaces.
In many other cases sorting objects by distance will not work either, for example, consider the classic case below. There is no known real time solution to this problem, other than to use an OIT technique.
Let's take a look how Unreal Engine solves this. As mentioned they are using MLAB, but the implementation is quite unusual. There is a raster order view of the same size as the normal screen buffers, which contains a single sample count value for each pixel. Then, separate buffers are used to store the color, depth and transmittance of the individual layers, with N values for each pixel. Usually, N is 4 for a good balance between quality and performance.
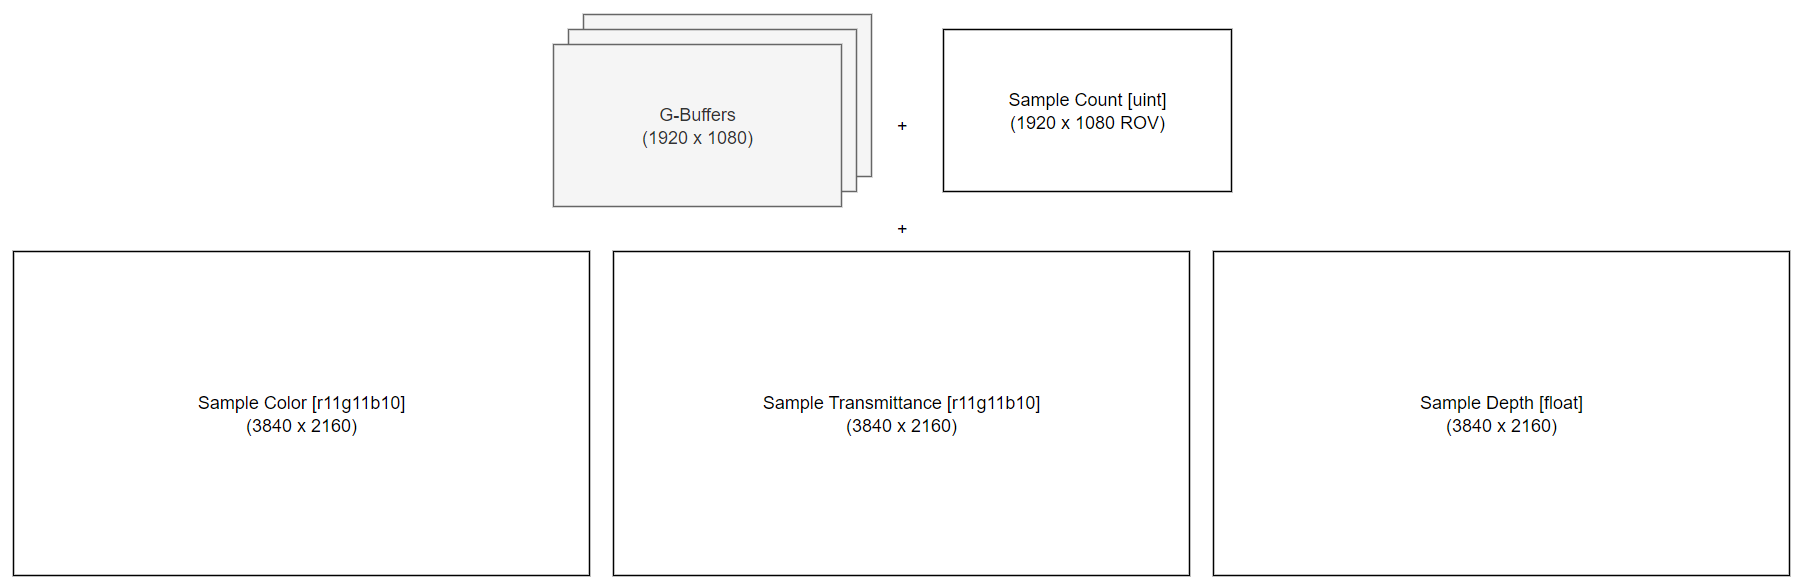
You might be wondering what a raster order view does. Usually the GPU handles many thousands of fragments concurrently, only merging them at the end. However, with OIT, our shader needs to write samples to the correct position for the current layer count, and potentially merge others! So we really don't want it to run multiple instances affecting the same pixel concurrently, because that corrupts our buffers and looks like this:
The raster order view solves this, by serializing operations for each pixel. So different pixels can still run in parallel, but we're no longer messing up the values in our buffers by running multiple fragments affecting the same pixel at once.
Let's follow rendering the scene from above again, but this time with OIT!
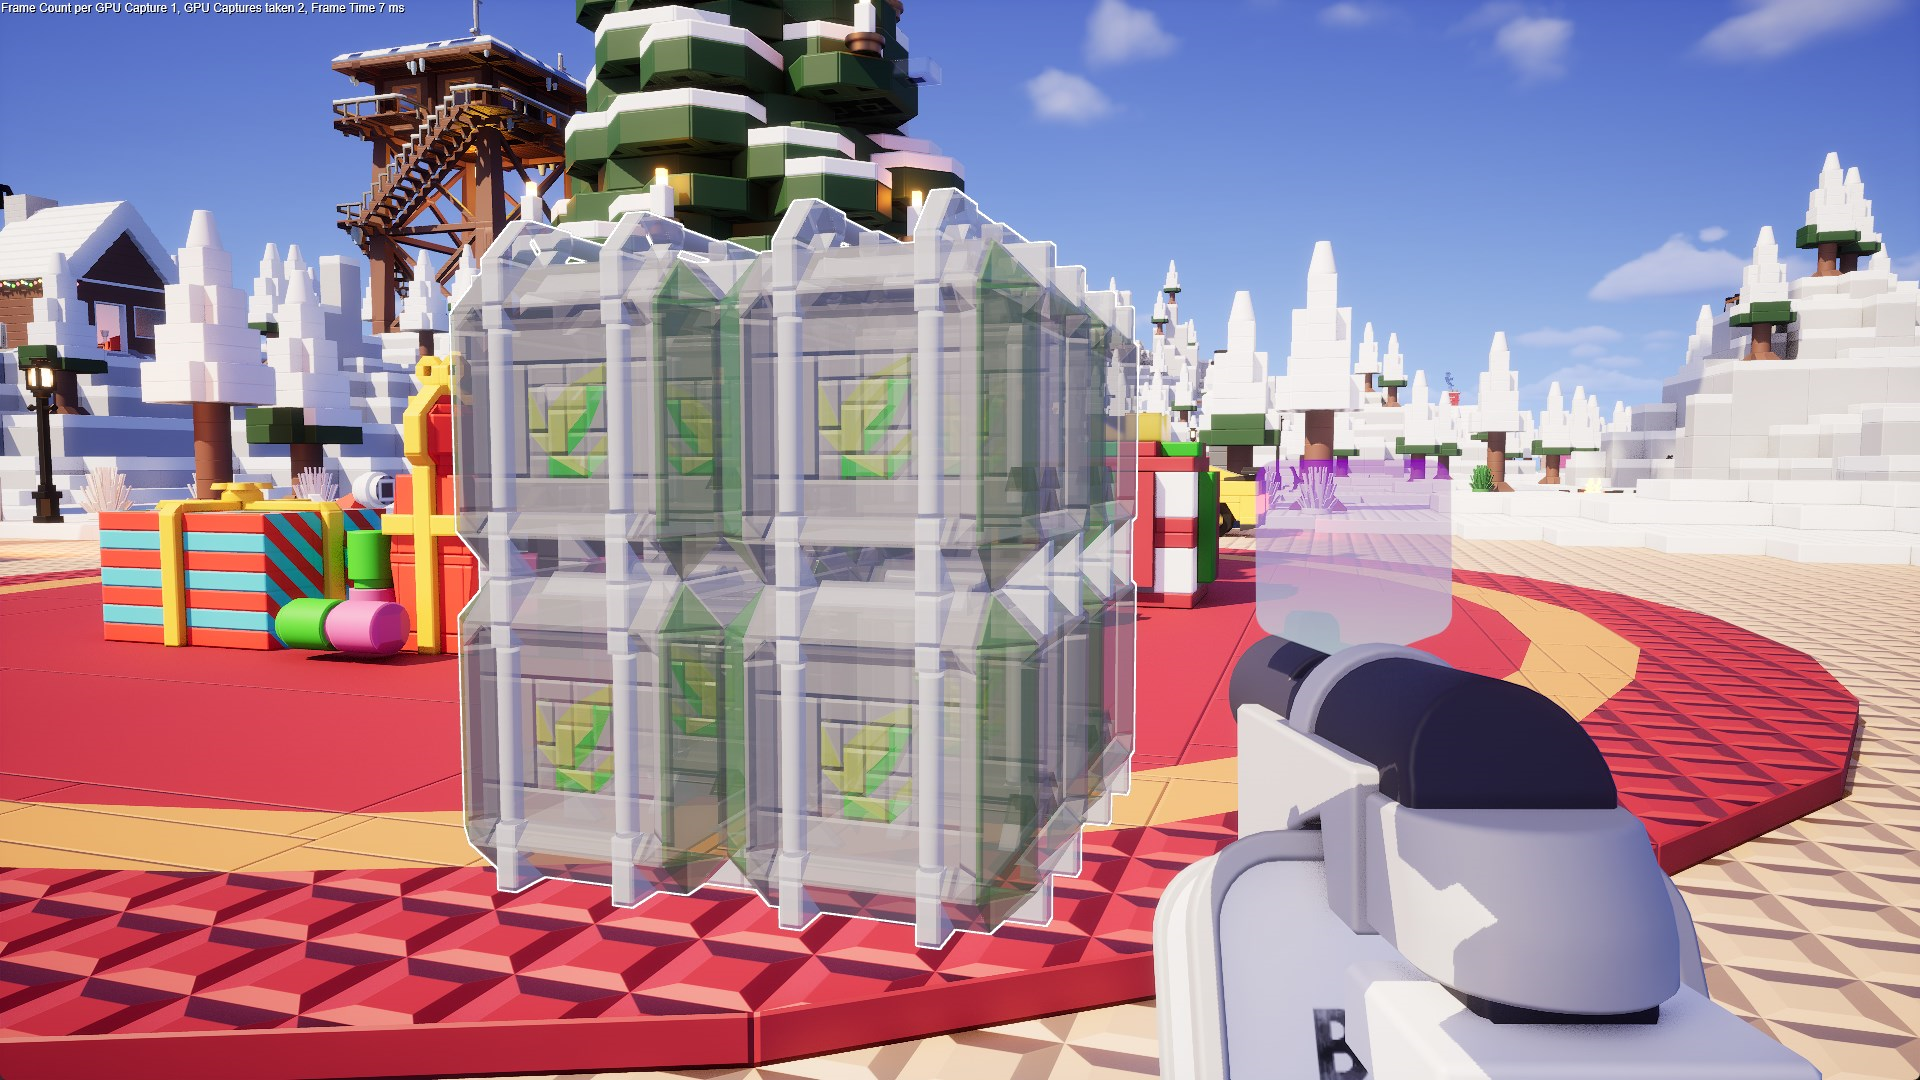
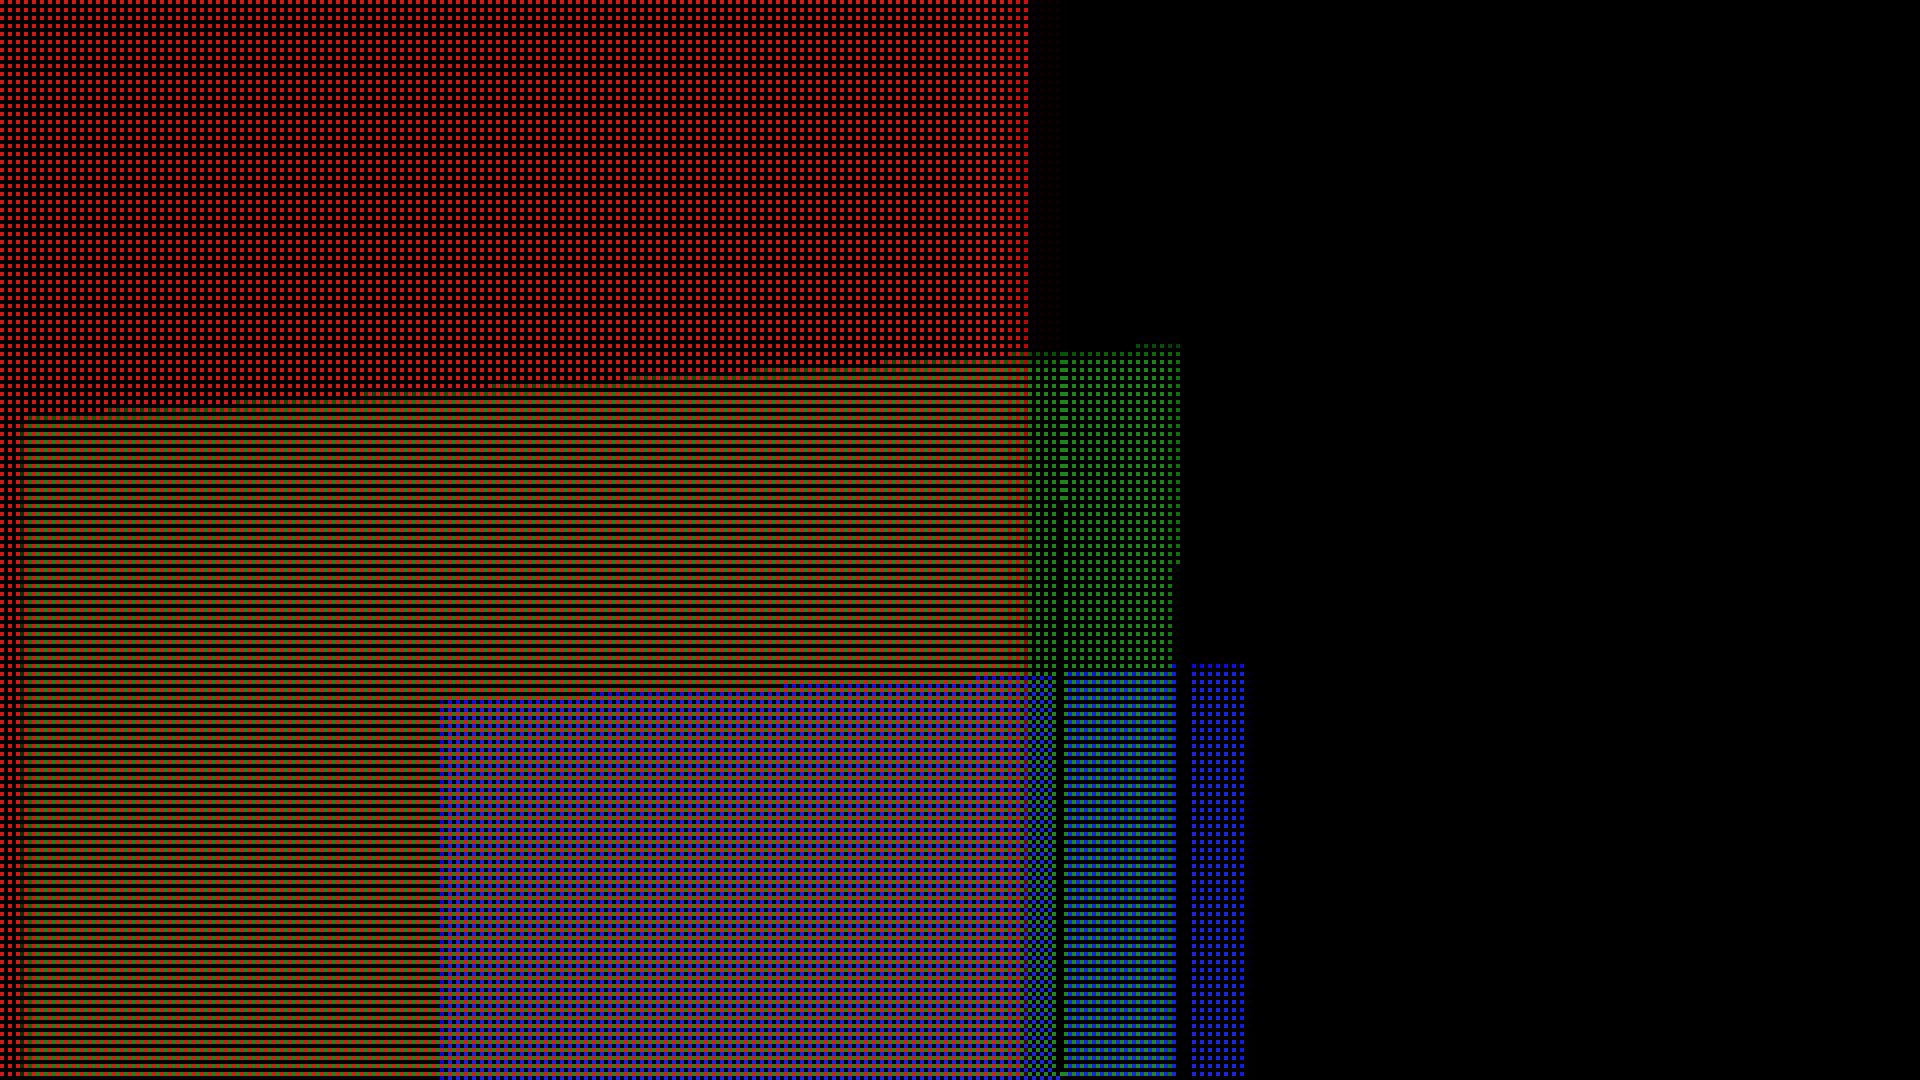
Up to the opaque scene being rendered, everything works the same as before. However, translucent objects now render to the OIT buffers rather than directly onto the scene color. Since the OIT buffers are so large, I changed the main resolution of the window to 960x560, but here is what these look like once we're done rendering translucent objects:
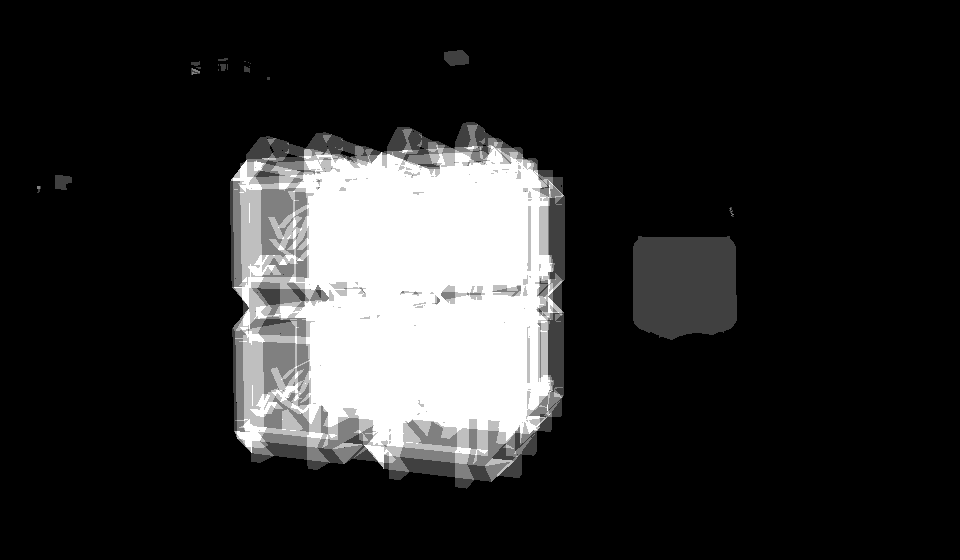
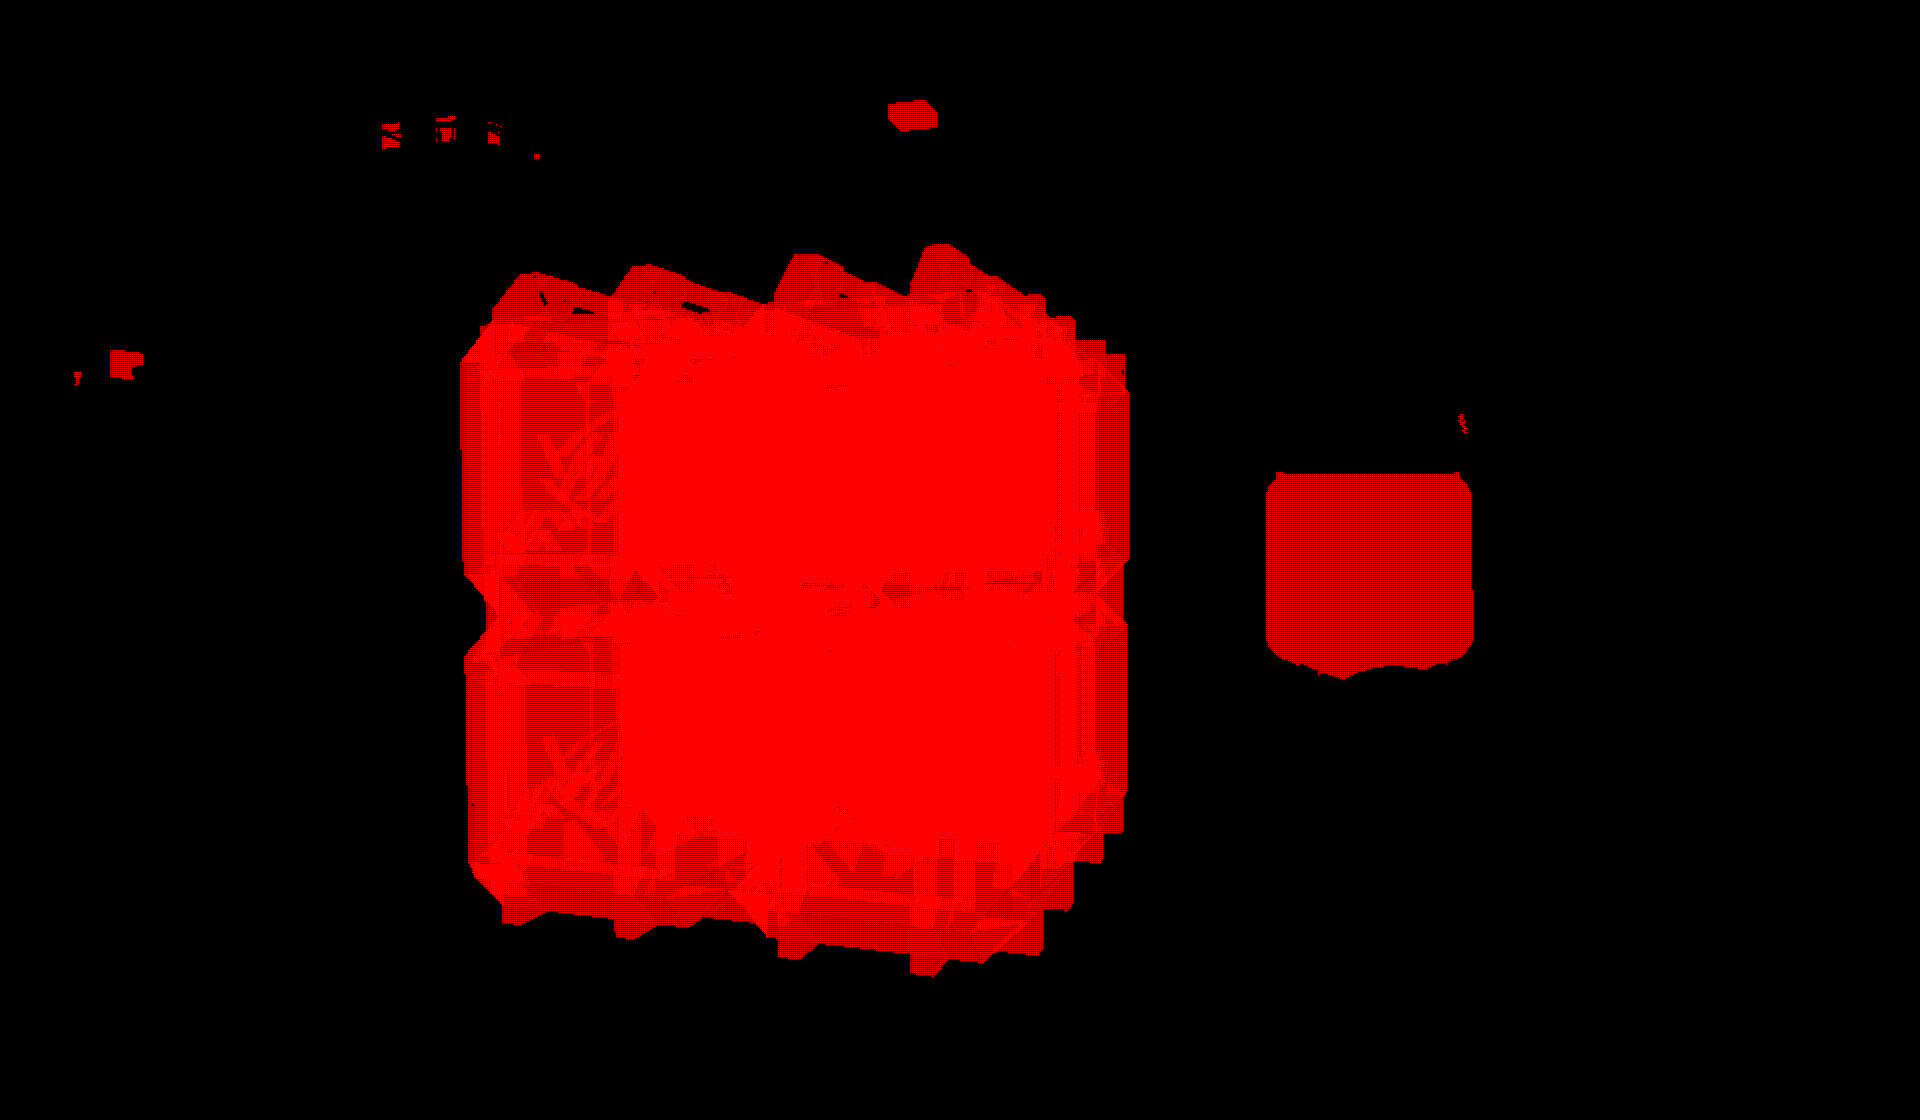
At this point I found out that these buffers are encoded in r11g11b10 format, which is rather annoying, because the engine only binds them as r32 buffers, so they don't display correctly in any visualization tool. Long story short, we can use a custom visualization shader in RenderDoc that decodes the texture, and since I found no useful minimal examples of this being done anywhere on the internet, here is the code that displays the texture in the correct format:

// This is the standard r11g11b10 unpacking function
float3 UnpackR11G11B10F(uint rgb)
{
	float r = f16tof32((rgb >> 17) & 0x7FF0);
	float g = f16tof32((rgb >> 6) & 0x7FF0);
	float b = f16tof32((rgb << 5) & 0x7FE0);
	return float3(r, g, b);
}

// This is how you access the selected texture in RenderDoc
// For some inexplicable reason it is always an array
uint4 RD_TexDim();
Texture2DArray<uint> texArray : register(RD_UINT_2D_ARRAY_BINDING);

float4 main(float4 pos : SV_Position, float4 UV : TEXCOORD0) : SV_Target0
{
	uint4 res = RD_TexDim();
	uint packed = texArray.Load(int4(UV.xy * res.xy, 0, 0)).r;

	return float4(UnpackR11G11B10F(packed), 1.f);
}
Now we can continue looking at our buffers.
The interleaved layers are easier to see, if we zoom in to the image. Here each group of 2x2 values represents data for one pixel of the final image.
Once we have collected all this data, a combine pass will flatten these layers onto the scene color, and we can resume the same rendering path as without OIT.
This scene was a bit messy, so here is another example with a much simpler one. We're rendering three tinted glass panes in a row.
Due to the separate buffers, this implementation is highly efficient for cases where not much translucency is actually on screen, so basically most real scenes. On most pixels we'll just read that the sample count is 0 during the combine pass, and skip them entirely. It requires little memory bandwidth to run too, as only the minimal amount of data actually needed is being written to the buffers. But this doesn't mean it's free. We'll evaluate the performance later.
It's Never That Simple
The excitement of seeing translucent previews finally rendering in a sensible way did not last long at first. This is because when I turned my camera and breathed incorrectly, my whole computer would crash. Giving this build to a few testers to try on their machine, they could reproduce it, and crash their computers too.
Eventually we discovered that what happened is the GPU froze and timed out, also called a TDR, and the computer actually recovers after about a minute if you continue staring at a black screen for what feels like forever. Why it takes a minute to recover, when the timeout triggers after two seconds, remains a complete mystery. This was the first time I ever had Unreal Engine fail in this way, so I didn't really know how to go about debugging it. Also, the freeze only occurs in a shipping build, isn't that amazing?
Let's check if the game wrote something to its log file first.
[2023.11.04-21.36.38:515][110]LogD3D12RHI: Warning: GPU timeout: A payload (0x0000015E5AC55F00) on the [0x00000151B6270B00, 3D] queue has not completed after 5.000000 seconds.
[2023.11.04-21.37.34:005][110]LogD3D12RHI: Error: CurrentQueue.Fence.D3DFence->GetCompletedValue() failed
 at .\Runtime/D3D12RHI/Private/D3D12Submission.cpp:980
 with error DXGI_ERROR_DEVICE_REMOVED with Reason: DXGI_ERROR_DEVICE_HUNG

[2023.11.04-21.37.34:005][110]LogD3D12RHI: Error: [GPUBreadCrumb] Last tracked GPU operations:
[2023.11.04-21.37.34:005][110]LogD3D12RHI: Error: [GPUBreadCrumb]	3D Queue 0

[2023.11.04-21.37.34:010][110]LogD3D12RHI: Error: [GPUBreadCrumb]	Copy Queue 0

[2023.11.04-21.37.34:021][110]LogD3D12RHI: Error: [GPUBreadCrumb]	Compute Queue 0

[2023.11.04-21.37.34:032][110]LogD3D12RHI: Error: DRED: Last tracked GPU operations:
[2023.11.04-21.37.34:032][110]LogD3D12RHI: Error: DRED: No command list found with active outstanding operations (all finished or not started yet).
[2023.11.04-21.37.34:032][110]LogD3D12RHI: Error: DRED: No PageFault data.
[2023.11.04-21.37.34:032][110]LogD3D12RHI: Error: Memory Info from frame ID -1:
[2023.11.04-21.37.34:032][110]LogD3D12RHI: Error: 	Budget:	   0.00 MB
[2023.11.04-21.37.34:032][110]LogD3D12RHI: Error: 	Used:	   0.00 MB
[2023.11.04-21.37.34:044][110]LogD3D12RHI: Error: GPU Crashed or D3D Device Removed.

Use -d3ddebug to enable the D3D debug device.
Use -gpucrashdebugging to track current GPU state.
It did, but the output is not useful, it's basically just telling us "yes it crashed". We can try to add those two command line arguments it suggests, but neither of them are useful: -d3ddebug does nothing, and -gpucrashdebugging makes the game run slower without triggering the freeze at all.
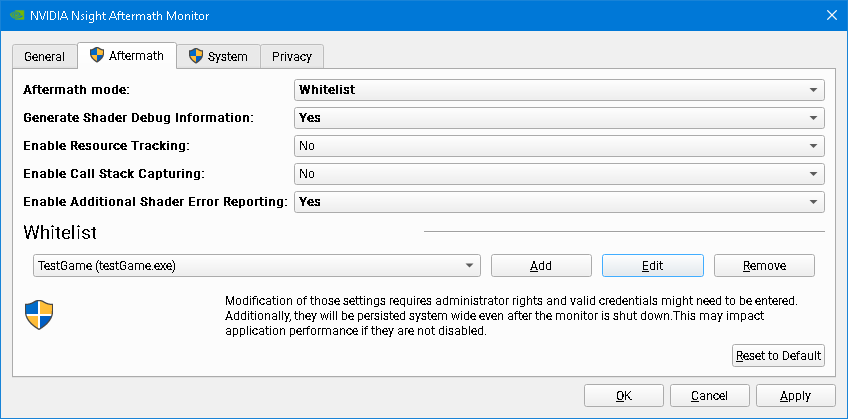
After looking around more, I discovered Unreal Engine also integrates something called NVIDIA Aftermath which should give us more information. However, the documentation just tells us the same flag again, which hides the freeze!
Digging through the code, I found that you can enable Aftermath by itself with the following arguments: "-nvaftermath -aftermathall". This way it's not enabling the other systems that hide the freeze at the same time.
We get a little more information this time!
[2023.11.04-22.51.53:639][270]LogD3D12RHI: Warning: GPU timeout: A payload (0x00000220144D6200) on the [0x00000213EE430B00, 3D] queue has not completed after 5.000000 seconds.
[2023.11.04-22.52.48:744][270]LogD3D12RHI: Error: CurrentQueue.Fence.D3DFence->GetCompletedValue() failed
 at .\Runtime/D3D12RHI/Private/D3D12Submission.cpp:980
 with error DXGI_ERROR_DEVICE_REMOVED with Reason: DXGI_ERROR_DEVICE_HUNG

[2023.11.04-22.52.48:744][270]LogRHI: Error: [Aftermath] Status: Timeout
[2023.11.04-22.52.48:746][270]LogRHI: Error: [Aftermath] Scanning 22 command lists for dumps
[2023.11.04-22.52.48:746][270]LogRHI: Error: [Aftermath] Context 0, command list 00000213ED87E4F0, status Finished, 0 markers. Begin GPU Stack Dump
[2023.11.04-22.52.48:746][270]LogRHI: Error: [Aftermath] End GPU Stack Dump
[2023.11.04-22.52.48:746][270]LogRHI: Error: [Aftermath] Context 1, command list 00000213F88B0A00, status Finished, 0 markers. Begin GPU Stack Dump
[2023.11.04-22.52.48:746][270]LogRHI: Error: [Aftermath] End GPU Stack Dump
[2023.11.04-22.52.48:746][270]LogRHI: Error: [Aftermath] Context 2, command list 0000021388881020, status Finished, 0 markers. Begin GPU Stack Dump
[2023.11.04-22.52.48:746][270]LogRHI: Error: [Aftermath] End GPU Stack Dump
[2023.11.04-22.52.48:746][270]LogRHI: Error: [Aftermath] Context 3, command list 00000213A921ADE0, status Finished, 0 markers. Begin GPU Stack Dump
[2023.11.04-22.52.48:746][270]LogRHI: Error: [Aftermath] End GPU Stack Dump
[2023.11.04-22.52.48:746][270]LogRHI: Error: [Aftermath] Context 4, command list 00000213A920F0B0, status Finished, 0 markers. Begin GPU Stack Dump
[2023.11.04-22.52.48:746][270]LogRHI: Error: [Aftermath] End GPU Stack Dump
[2023.11.04-22.52.48:746][270]LogRHI: Error: [Aftermath] Context 5, command list 00000213AFD34050, status Finished, 0 markers. Begin GPU Stack Dump
[2023.11.04-22.52.48:746][270]LogRHI: Error: [Aftermath] Context 6, command list 00000213A920C690, status Executing, 3 markers. Begin GPU Stack Dump
[2023.11.04-22.52.48:746][270]LogRHI: Error: [Aftermath] 0: Scene
[2023.11.04-22.52.48:746][270]LogRHI: Error: [Aftermath] 1: Translucency
[2023.11.04-22.52.48:746][270]LogRHI: Error: [Aftermath] 2: Translucency(%s Parallel) %dx%d
[2023.11.04-22.52.48:746][270]LogRHI: Error: [Aftermath] End GPU Stack Dump
[2023.11.04-22.52.48:746][270]LogRHI: Error: [Aftermath] Context 7, command list 00000213A9209C70, status Finished, 1 markers. Begin GPU Stack Dump
[2023.11.04-22.52.48:746][270]LogRHI: Error: [Aftermath] 0: EnqueueCopy(%s)
[2023.11.04-22.52.48:746][270]LogRHI: Error: [Aftermath] End GPU Stack Dump
[2023.11.04-22.52.48:746][270]LogRHI: Error: [Aftermath] Context 8, command list 00000213B393E490, status Finished, 0 markers. Begin GPU Stack Dump
[2023.11.04-22.52.48:746][270]LogRHI: Error: [Aftermath] End GPU Stack Dump
[2023.11.04-22.52.48:746][270]LogRHI: Error: [Aftermath] Context 9, command list 00000213A92105C0, status Finished, 0 markers. Begin GPU Stack Dump
[2023.11.04-22.52.48:746][270]LogRHI: Error: [Aftermath] End GPU Stack Dump
[2023.11.04-22.52.48:746][270]LogRHI: Error: [Aftermath] Context 10, command list 00000213A920B180, status Finished, 0 markers. Begin GPU Stack Dump
[2023.11.04-22.52.48:746][270]LogRHI: Error: [Aftermath] End GPU Stack Dump
[2023.11.04-22.52.48:746][270]LogRHI: Error: [Aftermath] Context 11, command list 00000213AB9A7B40, status Finished, 2 markers. Begin GPU Stack Dump
[2023.11.04-22.52.48:746][270]LogRHI: Error: [Aftermath] 0: Scene
[2023.11.04-22.52.48:746][270]LogRHI: Error: [Aftermath] 1: FGPUSortManager::OnPostRenderOpaque
[2023.11.04-22.52.48:746][270]LogRHI: Error: [Aftermath] End GPU Stack Dump
[2023.11.04-22.52.48:746][270]LogRHI: Error: [Aftermath] Context 12, command list 00000213AB9A9050, status Finished, 2 markers. Begin GPU Stack Dump
[2023.11.04-22.52.48:746][270]LogRHI: Error: [Aftermath] 0: Scene
[2023.11.04-22.52.48:746][270]LogRHI: Error: [Aftermath] 1: ClearRenderTarget(%s, slice %d, mip %d) %dx%d ClearAction
[2023.11.04-22.52.48:746][270]LogRHI: Error: [Aftermath] End GPU Stack Dump
[2023.11.04-22.52.48:746][270]LogRHI: Error: [Aftermath] Context 13, command list 0000000000000000, status Finished, 0 markers. Begin GPU Stack Dump
[2023.11.04-22.52.48:746][270]LogRHI: Error: [Aftermath] End GPU Stack Dump
[2023.11.04-22.52.48:746][270]LogRHI: Error: [Aftermath] Context 14, command list 0000000000000000, status Finished, 0 markers. Begin GPU Stack Dump
[2023.11.04-22.52.48:746][270]LogRHI: Error: [Aftermath] End GPU Stack Dump
[2023.11.04-22.52.48:746][270]LogRHI: Error: [Aftermath] Context 15, command list 0000000000000000, status Finished, 0 markers. Begin GPU Stack Dump
[2023.11.04-22.52.48:746][270]LogRHI: Error: [Aftermath] End GPU Stack Dump
[2023.11.04-22.52.48:746][270]LogRHI: Error: [Aftermath] Context 16, command list 0000000000000000, status Finished, 0 markers. Begin GPU Stack Dump
[2023.11.04-22.52.48:746][270]LogRHI: Error: [Aftermath] End GPU Stack Dump
[2023.11.04-22.52.48:746][270]LogRHI: Error: [Aftermath] Context 17, command list 0000000000000000, status Finished, 0 markers. Begin GPU Stack Dump
[2023.11.04-22.52.48:746][270]LogRHI: Error: [Aftermath] End GPU Stack Dump
[2023.11.04-22.52.48:746][270]LogRHI: Error: [Aftermath] Context 18, command list 0000000000000000, status Finished, 0 markers. Begin GPU Stack Dump
[2023.11.04-22.52.48:746][270]LogRHI: Error: [Aftermath] End GPU Stack Dump
[2023.11.04-22.52.48:746][270]LogRHI: Error: [Aftermath] Context 19, command list 00000213AF9F79F0, status Finished, 0 markers. Begin GPU Stack Dump
[2023.11.04-22.52.48:746][270]LogRHI: Error: [Aftermath] End GPU Stack Dump
[2023.11.04-22.52.48:746][270]LogRHI: Error: [Aftermath] Context 20, command list 00000213AF9F3AC0, status Finished, 0 markers. Begin GPU Stack Dump
[2023.11.04-22.52.48:746][270]LogRHI: Error: [Aftermath] End GPU Stack Dump
[2023.11.04-22.52.48:746][270]LogRHI: Error: [Aftermath] Context 21, command list 0000000000000000, status Finished, 0 markers. Begin GPU Stack Dump
[2023.11.04-22.52.48:746][270]LogRHI: Error: [Aftermath] End GPU Stack Dump
This is again not actually helpful though. The most we can tell from this output is that the issue occurs during "Translucency", which is about what we'd expect to happen given the freeze only occurs when OIT is enabled, but it tells us nothing about the underlying cause. So we'll need another approach.
Searching the internet for how to debug a TDR, one thing I found was this page explaining that you can analyze a TDR with PIX. Except that to analyze it, it has to take a single-frame capture on exactly the frame that causes the freeze. With it seemingly freezing randomly during camera movement, how are we meant to know in advance which frame will freeze to capture it? This feature seems a bit useless to me, though maybe there are some situations where you can accurately reproduce the issue like that. It's certainly not going to help us.
Then I discovered that NVIDIA Aftermath is not just the library the engine uses, there are also standalone tools for interacting with it. After setting up the crash monitor on my computer, it did indeed capture the TDR in Nsight.
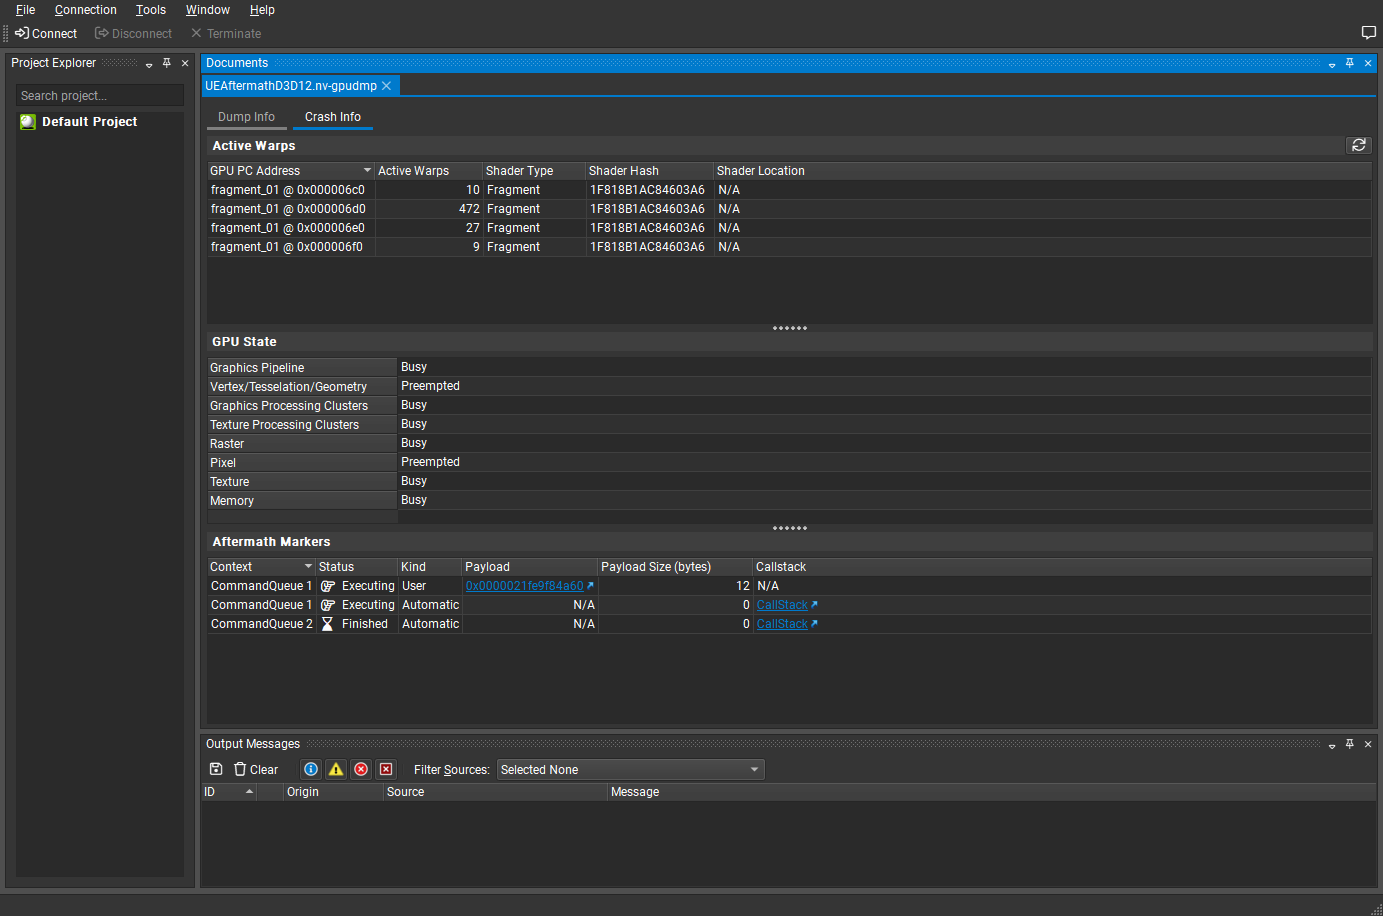
But we don't have any shader symbols, so it's useless in its current state.
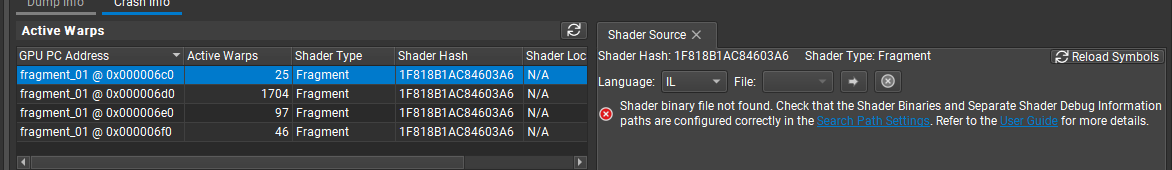
We can follow the instructions on their documentation and hook up the separate shader debugging information that Unreal Engine optionally generates during packaging to get this working.
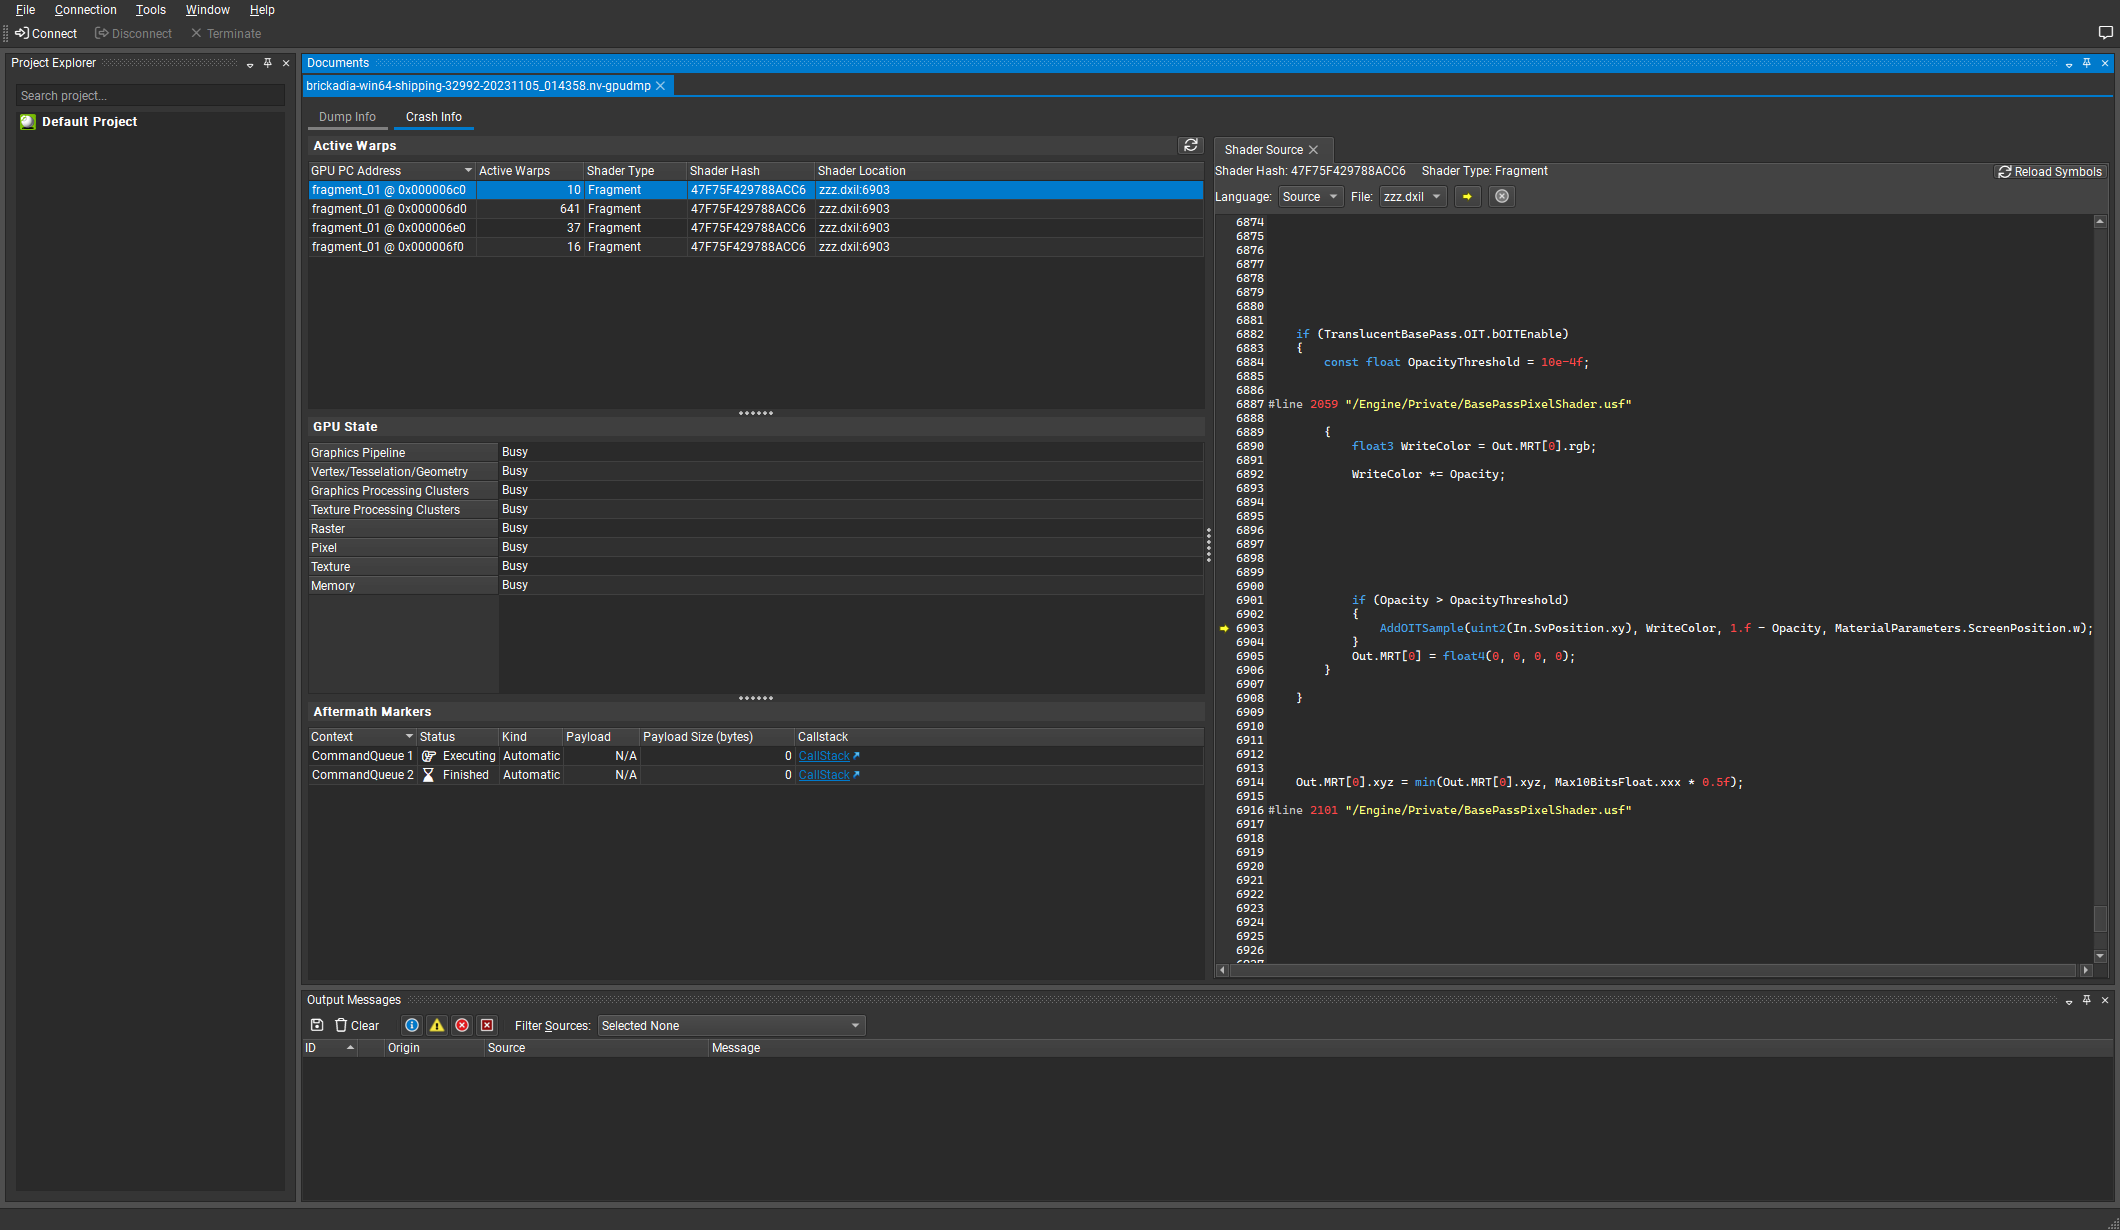
Now we can tell that the GPU is freezing inside the AddOITSample method in the translucent base pass shader! I didn't have access to Nsight Graphics Pro while I was investigating this last month, and this is as far as the no-NDA edition will get us. But we can still manually review this function and the surrounding code and see if any issues pop out.
There's definitely a questionable control flow here:
void AddOITSample_MLAB(uint2 InPixelCoord, float3 InColor, float3 InTrans, float InDepth)
{
    // ROV read to for pixel synchronization
    uint SampleCount = min(TranslucentBasePass.OIT.OutOITSampleCount[InPixelCoord], TranslucentBasePass.OIT.MaxSamplePerPixel);

    [...]

    if (SampleCount > 0)
    {
        const uint2 LastSampleCoord = GetStoringCoord(SampleBaseCoord, SampleCount-1);
        const FOITSample LastSample = OITLoadSample(LastSampleCoord);
        if (Current.Depth > LastSample.Depth) // Scene depth (not inv-Z)
        {
            if (all(LastSample.Trans < TranslucentBasePass.OIT.TransmittanceThreshold))
            {
                discard;
            }
        }
    }

    [...]

    // Write to ROV to unlock pixel
    SampleCount = min(SampleCount + 1, TranslucentBasePass.OIT.MaxSamplePerPixel);
    TranslucentBasePass.OIT.OutOITSampleCount[InPixelCoord] = SampleCount;
}
The shader starts by acquiring a lock on the raster order view, doing a bunch of logic, potentially discarding the current pixel if it is deemed irrelevant, at the end releasing the lock by writing back to the raster order view.
What exactly happens to our unlock write to the raster order view, if we have discarded the pixel above, which prevents the writes from actually happening? I honestly don't know the answer, but I made a little experiment here: let's just add return after discard, to force the compiler to generate explicit unlock instructions and exit the function right there.
    if (SampleCount > 0)
    {
        const uint2 LastSampleCoord = GetStoringCoord(SampleBaseCoord, SampleCount-1);
        const FOITSample LastSample = OITLoadSample(LastSampleCoord);
        if (Current.Depth > LastSample.Depth) // Scene depth (not inv-Z)
        {
            if (all(LastSample.Trans < TranslucentBasePass.OIT.TransmittanceThreshold))
            {
                discard;
                return;
            }
        }
    }
Surprisingly, this really did fix the issue. My GPU is no longer randomly freezing during translucency rendering, and neither are any of the others.
Another fix to be made here is that Epic had declared TransmittanceThreshold as the wrong type, it needs to be a float, not an integer. This had likely made the issue worse as the comparison was now invalid, causing more pixels to hit the discard case than intended.
But if this was the issue, why did the freeze only occur in the shipping build with GPU crash debugging disabled? Are we dealing with an optimization bug in the shader compiler or driver?
We could potentially figure this out with Nsight Graphics Pro now, but here is where I gave up on investigating further. It is somewhat unsatisfying to not have a complete low level explanation of what the GPU was hanging on or why it has been fixed by this change, but we can't lose ourselves in this one issue.
So are we done? I thought we were, until another tester reported the game not launching at all on his computer with an RX 580 GPU.
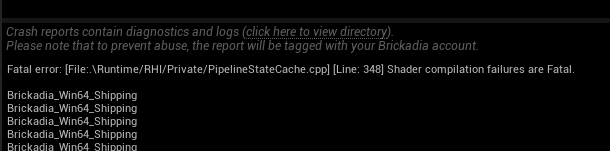
Running with -d3ddebug should tell us what caused the shader compilation error. Except that when he ran it on his computer, it would just show this message:
Fatal error: [File:.\Runtime/D3D12RHI/Private/D3D12Adapter.cpp] [Line: 418] The debug interface requires the D3D12 SDK Layers. Please install the Graphics Tools for Windows. See: https://docs.microsoft.com/en-us/windows/uwp/gaming/use-the-directx-runtime-and-visual-studio-graphics-diagnostic-features
Too bad that was already installed... now what? The log reveals another problem:
D3D Error 887e0003: (12600@88679078) at 00007FF9AEFFC9F0 - D3D12 SDKLayers dll not found at D3D12SDKPath.
So it seems the dll needed to run -d3ddebug was excluded from shipping builds by default, breaking the feature completely. Easy fix, just always include it.
            RuntimeDependencies.Add(
                "$(TargetOutputDir)/D3D12/D3D12Core.dll",
                DirectX.GetDllDir(Target) + "D3D12Core.dll");

            //if (Target.Configuration != UnrealTargetConfiguration.Shipping &&
            //    Target.Configuration != UnrealTargetConfiguration.Test)
            {
                RuntimeDependencies.Add(
                    "$(TargetOutputDir)/D3D12/d3d12SDKLayers.dll",
                    DirectX.GetDllDir(Target) + "d3d12SDKLayers.dll");
            }
Finally we get a message telling us the actual issue. Who would have thought there could be a DirectX12 capable GPU without support for raster order views?
D12 ERROR: ID3D12Device::CreatePixelShader: Shader uses Rasterizer Ordered Views, but the device does not support this. To check for support, check device caps via the CheckFeatureSupport() API [ STATE_CREATION ERROR #93: CREATEPIXELSHADER_INVALIDSHADERBYTECODE]
Epic didn't, apparently.
AdditionalDefines.SetDefine(TEXT("PLATFORM_SUPPORTS_ROV"), 1); // Assume min. spec HW supports with DX12/SM5
The problem this time was that having OIT enabled in the project would always bind a raster order view in the translucency shaders, even if not actually used. This then causes the game to crash, as those shaders fail to compile on GPUs that don't support raster order views, even if they are never used. Fixing this took more effort, but the gist is basically:
- Add a GRHISupportsRasterOrderViews flag next to all the other runtime feature flags that is populated from D3D12_FEATURE_DATA_D3D12_OPTIONS::ROVsSupported.
- Add a new r.OIT.SortedPixels.Enabled cvar that can be used to fully enable/disable OIT at runtime, to be controlled by graphics settings.
- Add a permutation domain to TBasePassPS with a PERMUTATION_SUPPORTS_OIT flag that is combined into OIT_ENABLED in BasePassPixelShader.usf. The extra permutation is only compiled for translucent materials and only if OIT is enabled for the project.
- Extend FBasePassMeshProcessor slightly to use the correct shader permutation depending on if we are drawing a translucent base pass that requests OIT.
Finally we can have optional OIT in our project, that can be toggled on and off from graphics settings. What an adventure!
PS: I sent my changes to Epic on UDN and they have integrated them into 5.4, so you should no longer hit these issues if you want to use OIT in your own projects.
Performance Testing
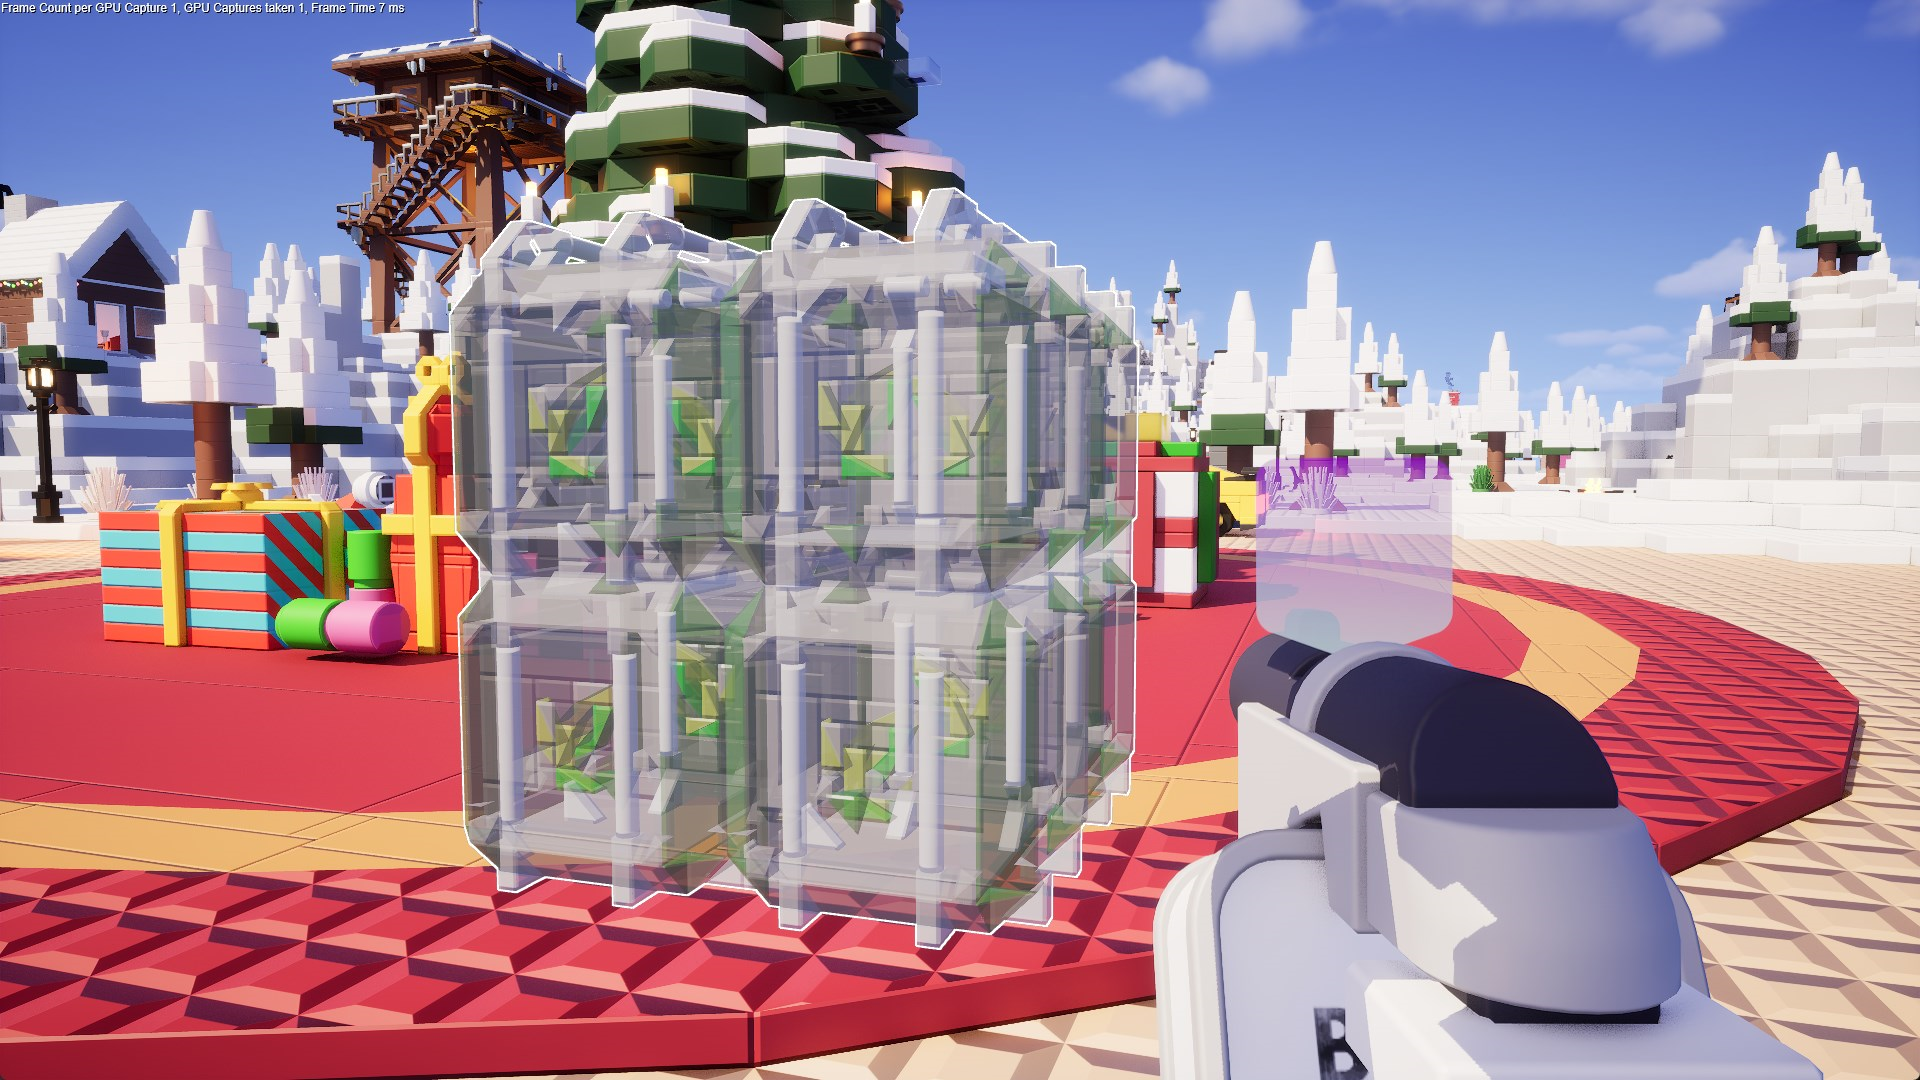
I'm using a PC with a GTX 1650 in this test, the smallest non-integrated GPU I have available currently from almost 5 years ago, running the game in 1080p with no upscaling. All the screenshots below have frame rate counters enabled.
We'll look at scenes with different amounts of translucent geometry visible on screen, from very little to filling the entire screen, and compare the performance with OIT on/off for each. I also chose not to enable the volumetric clouds here.
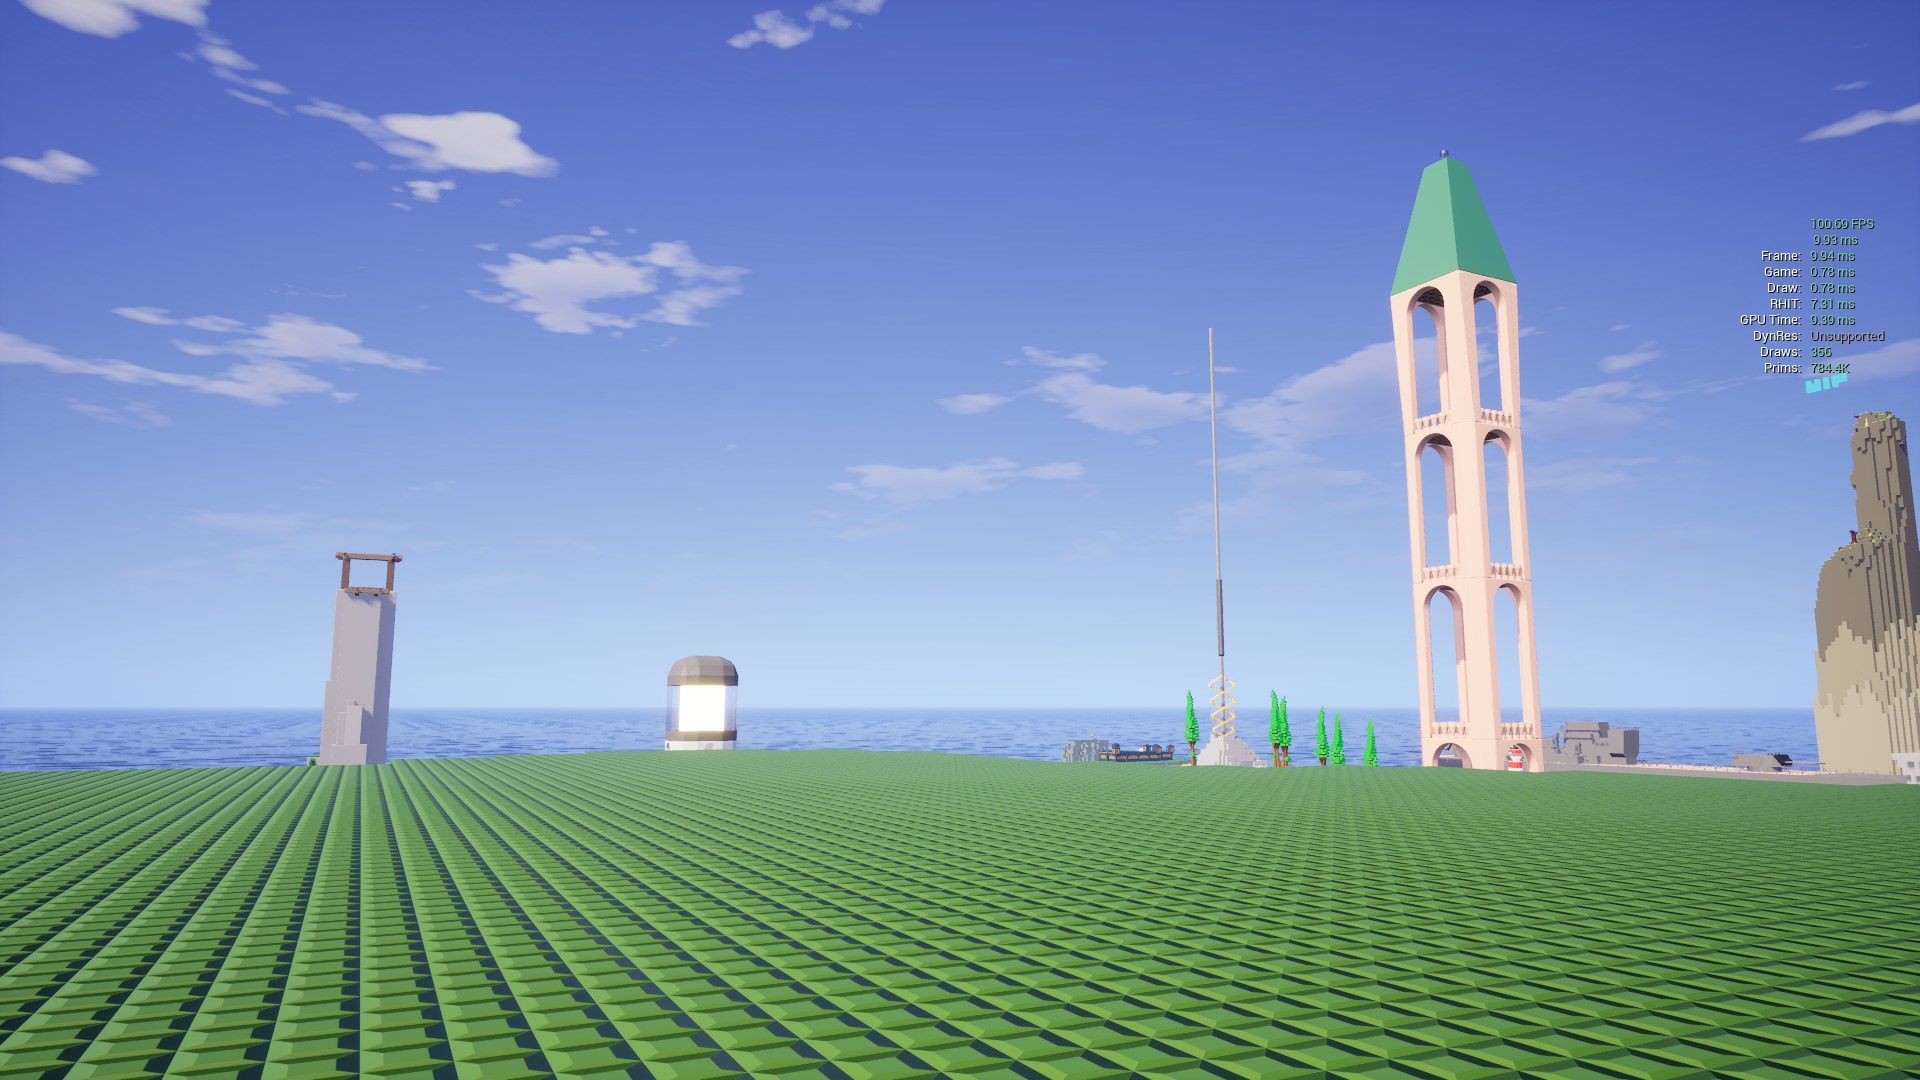
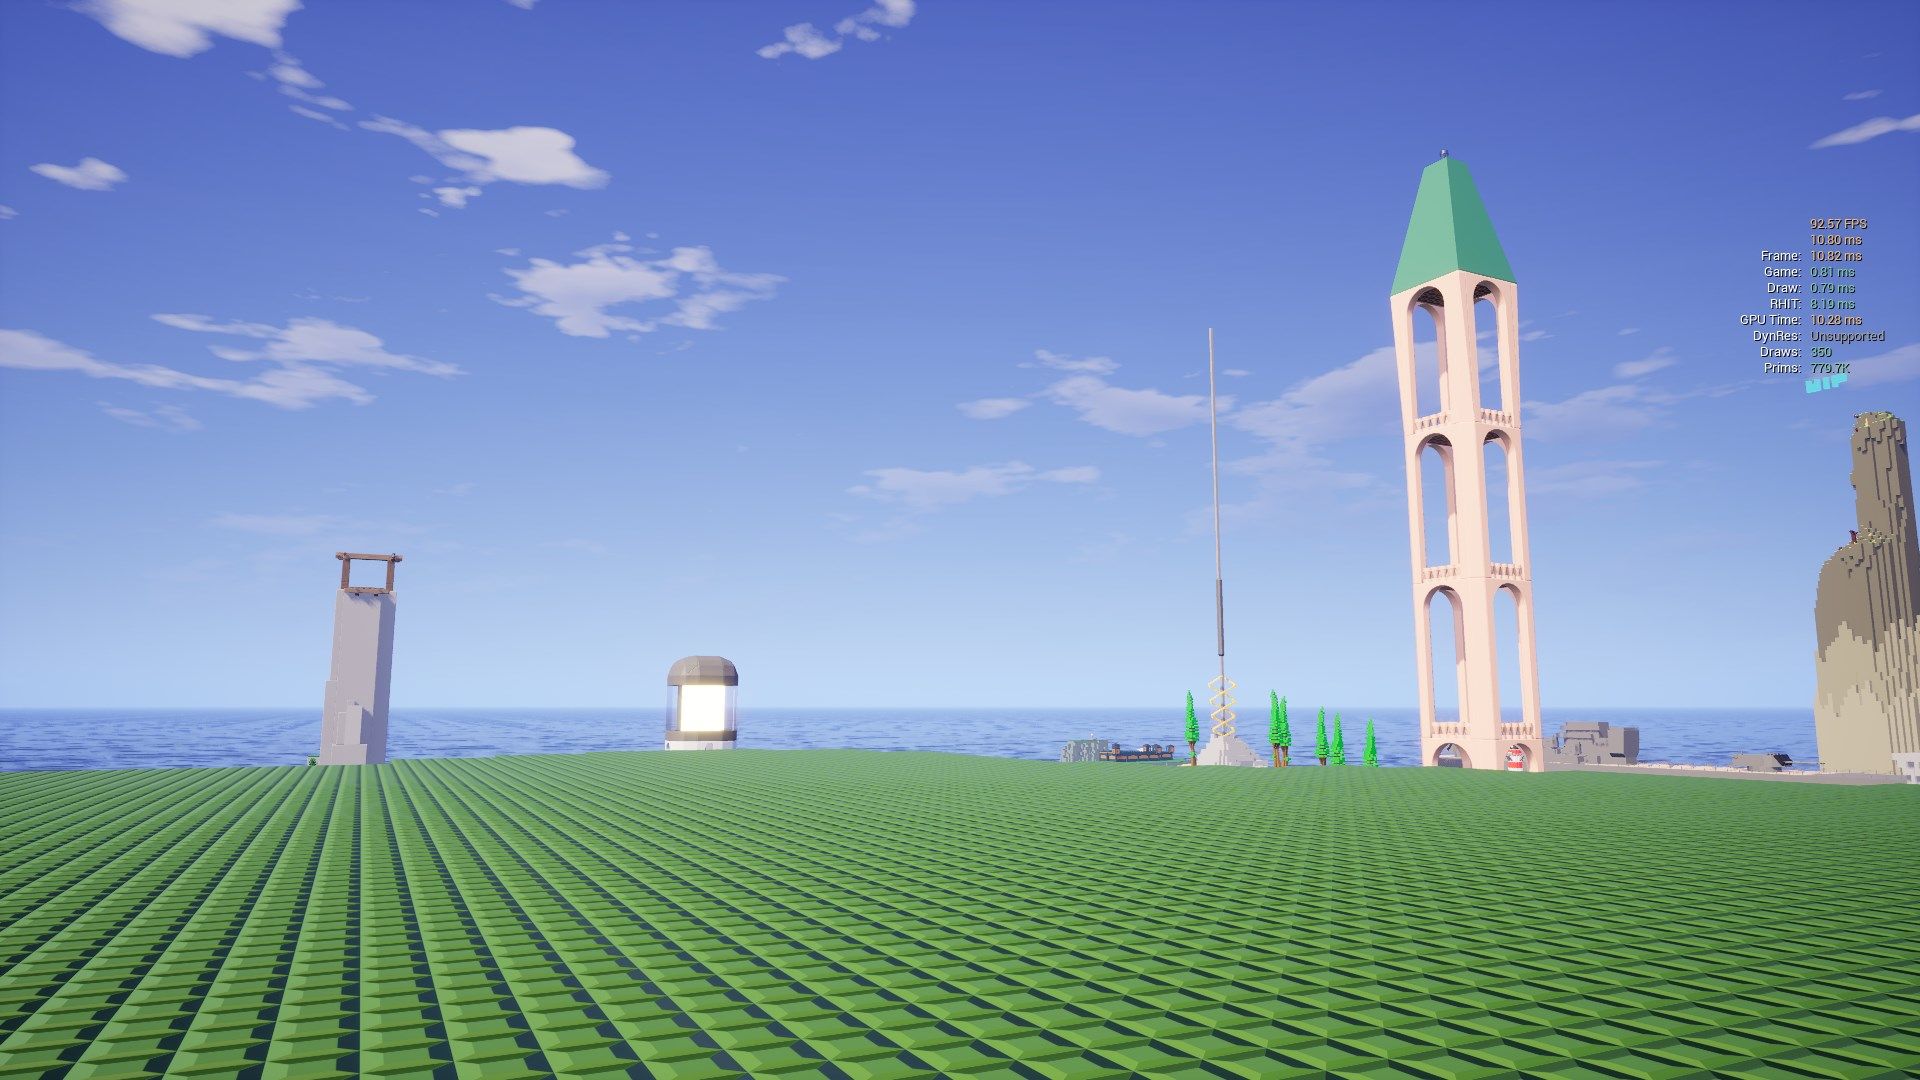
So this effect is still usable even on low end hardware, staying in playable framerates, as long as you don't go crazy filling the whole screen with it.
Is it worth it to enable? Maybe. Depends how much the wrong translucency sorting is annoying you while building, what hardware you currently use, and how much you can tolerate reducing your frame rate to fix it. I like to think that we are creating things for the future, not the past - the number of people who can run the effect will only increase over time.
On higher end systems, it's usually a non-issue, and I always keep it enabled myself. For example, here is a similar scene running on a RTX 4090:
High Dynamic Range Output
This is a pretty simple one, considering it's already integrated in Unreal Engine and you just have to turn it on. Except you can't use the existing function in the engine, of course, that would be too easy. For example, you might be looking at EnableHDRDisplayOutput and think it will do the trick, until you actually look at the code and notice that it changes the fullscreen setting for no reason.
Attempting to enable HDR also exposed a lot of issues with our environment setup. When I first tried it, the image was way too dark, and basically unusable on anything other than a TV with Dynamic Tone Mapping enabled to bring it back into a sensible range. Turns out our scenes did not have nearly enough light, which had been compensated for by the SDR tonemapper in previous versions.
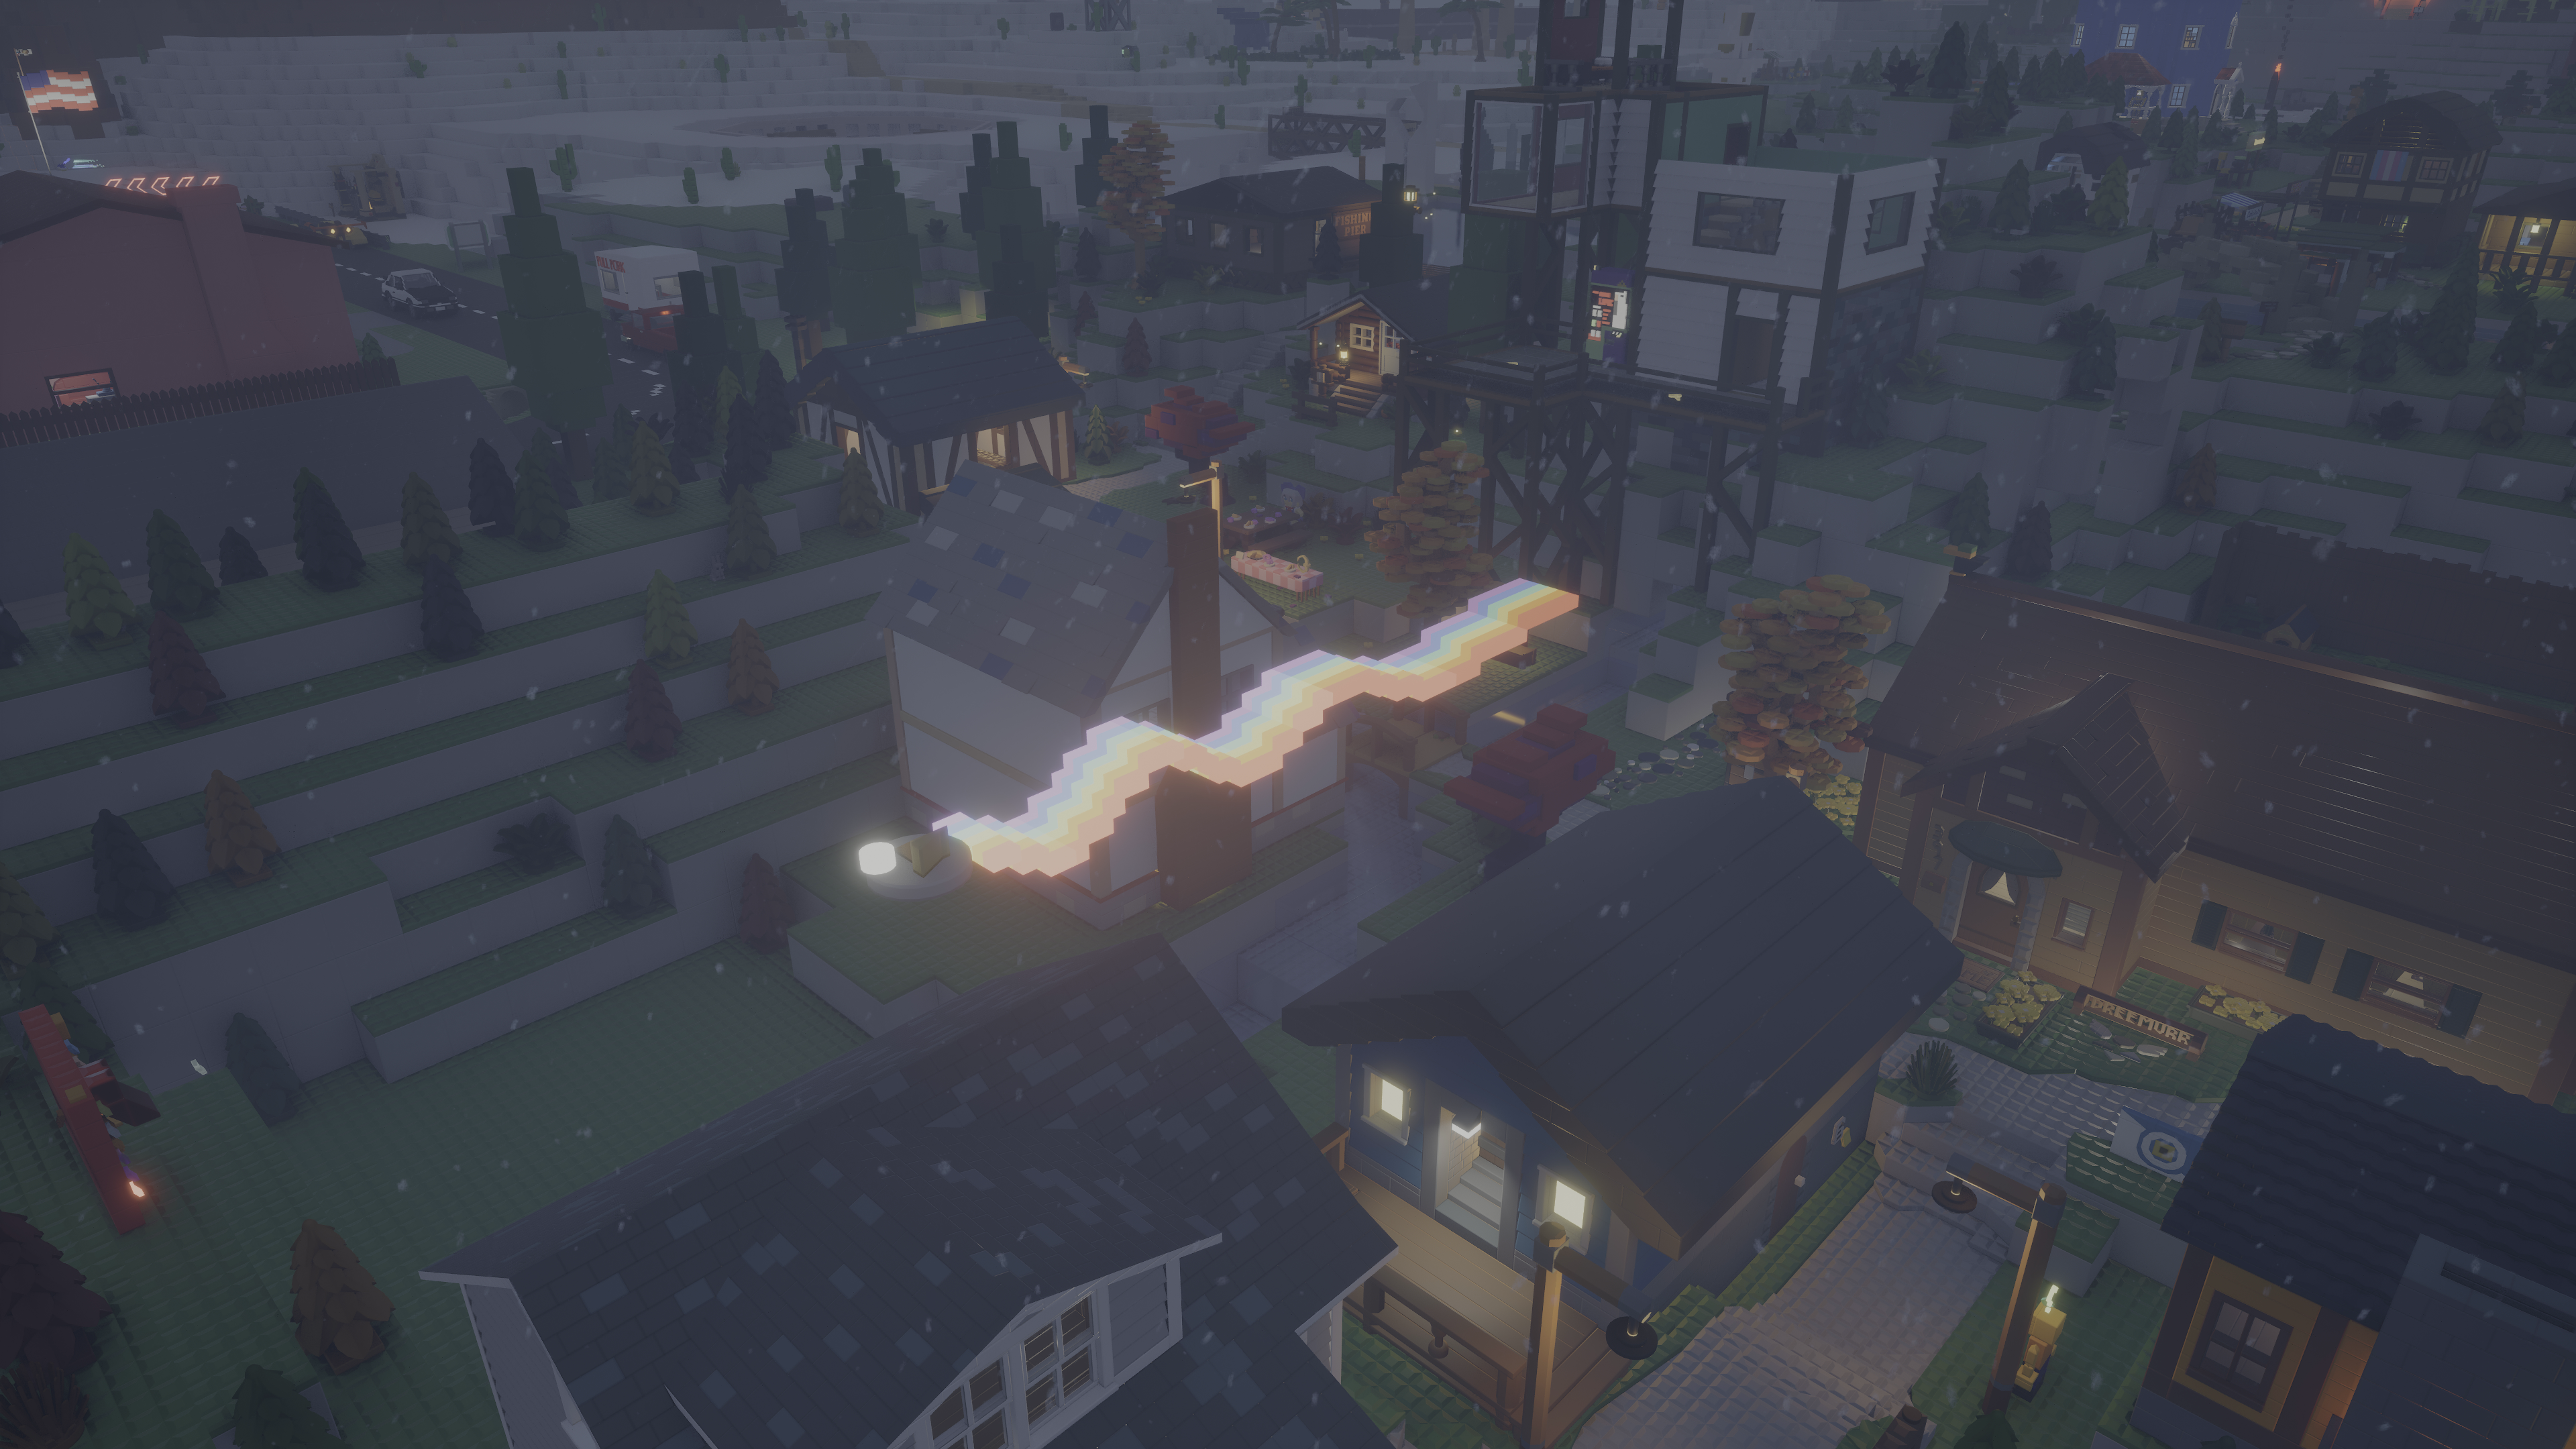
After fixing all those issues though, it looks absolutely fantastic. Seeing the game on the big LG OLED G3, with HDR enabled and all the settings maxed, is almost unbelievable - the sky during the day and emissive bricks at night especially.
I never want to play without it again! We've got a problem here though - I can't actually show it to you, unless you also have a good HDR display, enabled HDR for your desktop, and are using the latest version of Chrome. I have the game set to 1500 nits peak brightness, but that does not mean every scene will use it.
These images were captured in 4k HDR using Xbox Game Bar on Windows 11, which writes a JPEG-XR file, and then converted to AVIF using this tool I found, so they can display in the browser. On my computer, the version in the browser looks exactly the same as the game, but I have no idea if that works for you too.
Some troubleshooting if the images don't display correctly:
- If you don't have a HDR monitor, you can't view them.
- If you have HDR disabled in Windows, enable it.
- If you are using Edge or Firefox or something else, use Chrome.
- If you are using Chrome but the images are too dark, change the HDR brightness balance setting in Windows, or change the dynamic tone mapping setting on your display's menu.
- If you are not using Windows, I can't help you.
New Upscaling Plugins
I try to keep up to date on all the commonly used upscaling plugins, especially those that I use myself and know work very well. Here are some that were released over the past year, that will be available in Early Access:
DLSS 3 Frame Generation
Since NVIDIA released a plugin for DLSS 3 Frame Generation earlier this year, I have obviously already added this to the game.
This is some truly magic tech - by generating new frames inbetween the ones the game actually renders, your frame rate can be almost doubled in many cases. It works very well for taking a game running at 60 fps to around 100-120 fps.
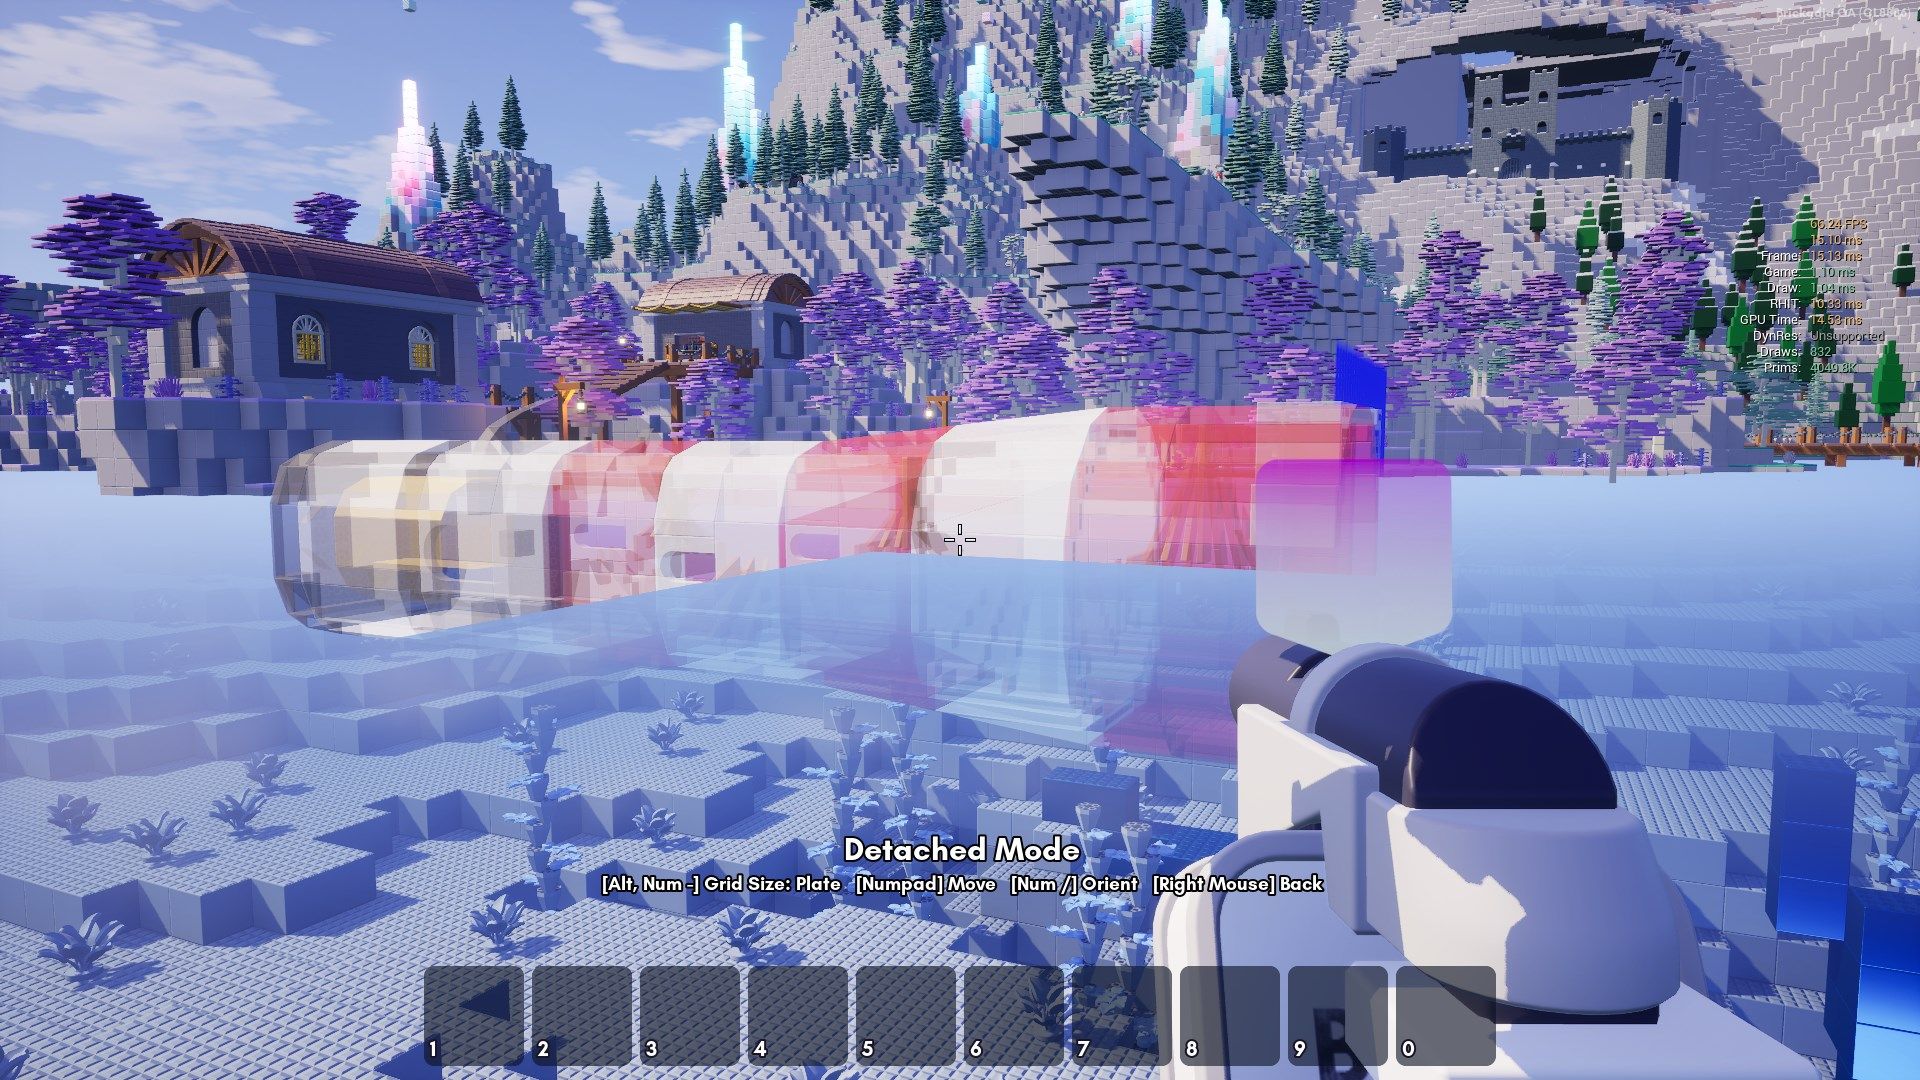
Unlike most graphics quality settings, this applies regardless if the bottleneck is your GPU or your CPU. So for example, you can use it to run some crazy physics contraptions! Do note though, that this requires at least a 40 series GPU. I have the RTX 4090 here, so let's try loading something completely absurd.
We'll start with this classic map built from about 2.3 million bricks as a backdrop.
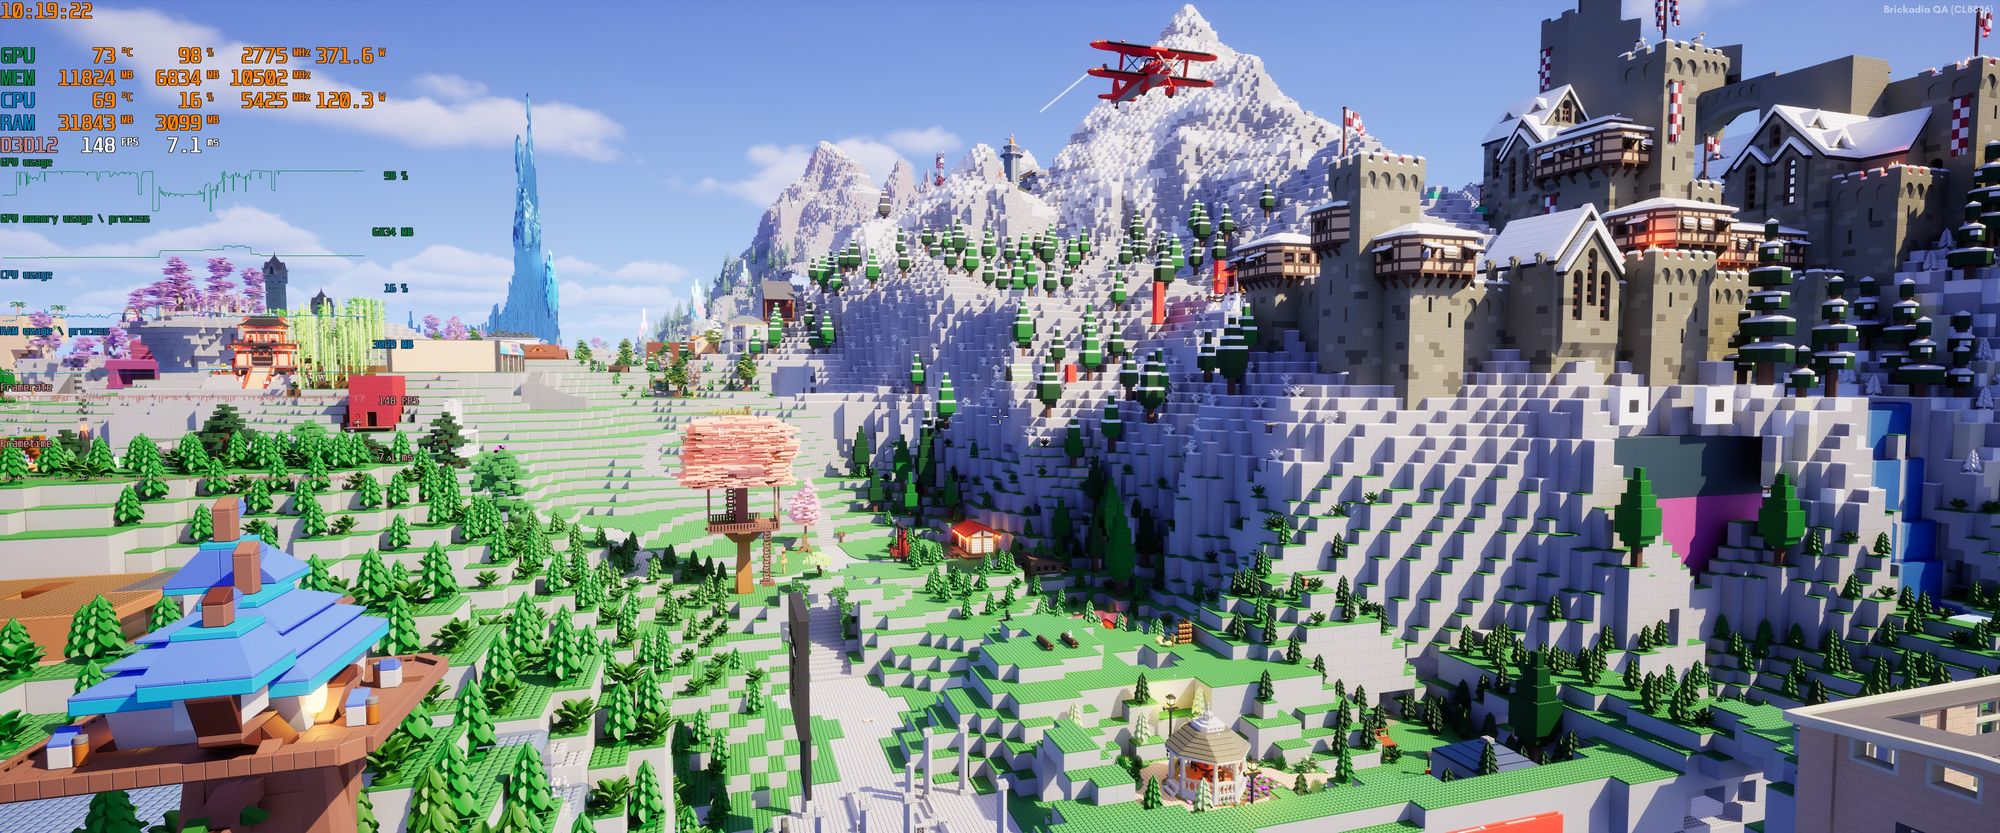
Then we'll load in a space ship built from roughly 2500 bricks, with multiple materials like glass in use and even some components attached.
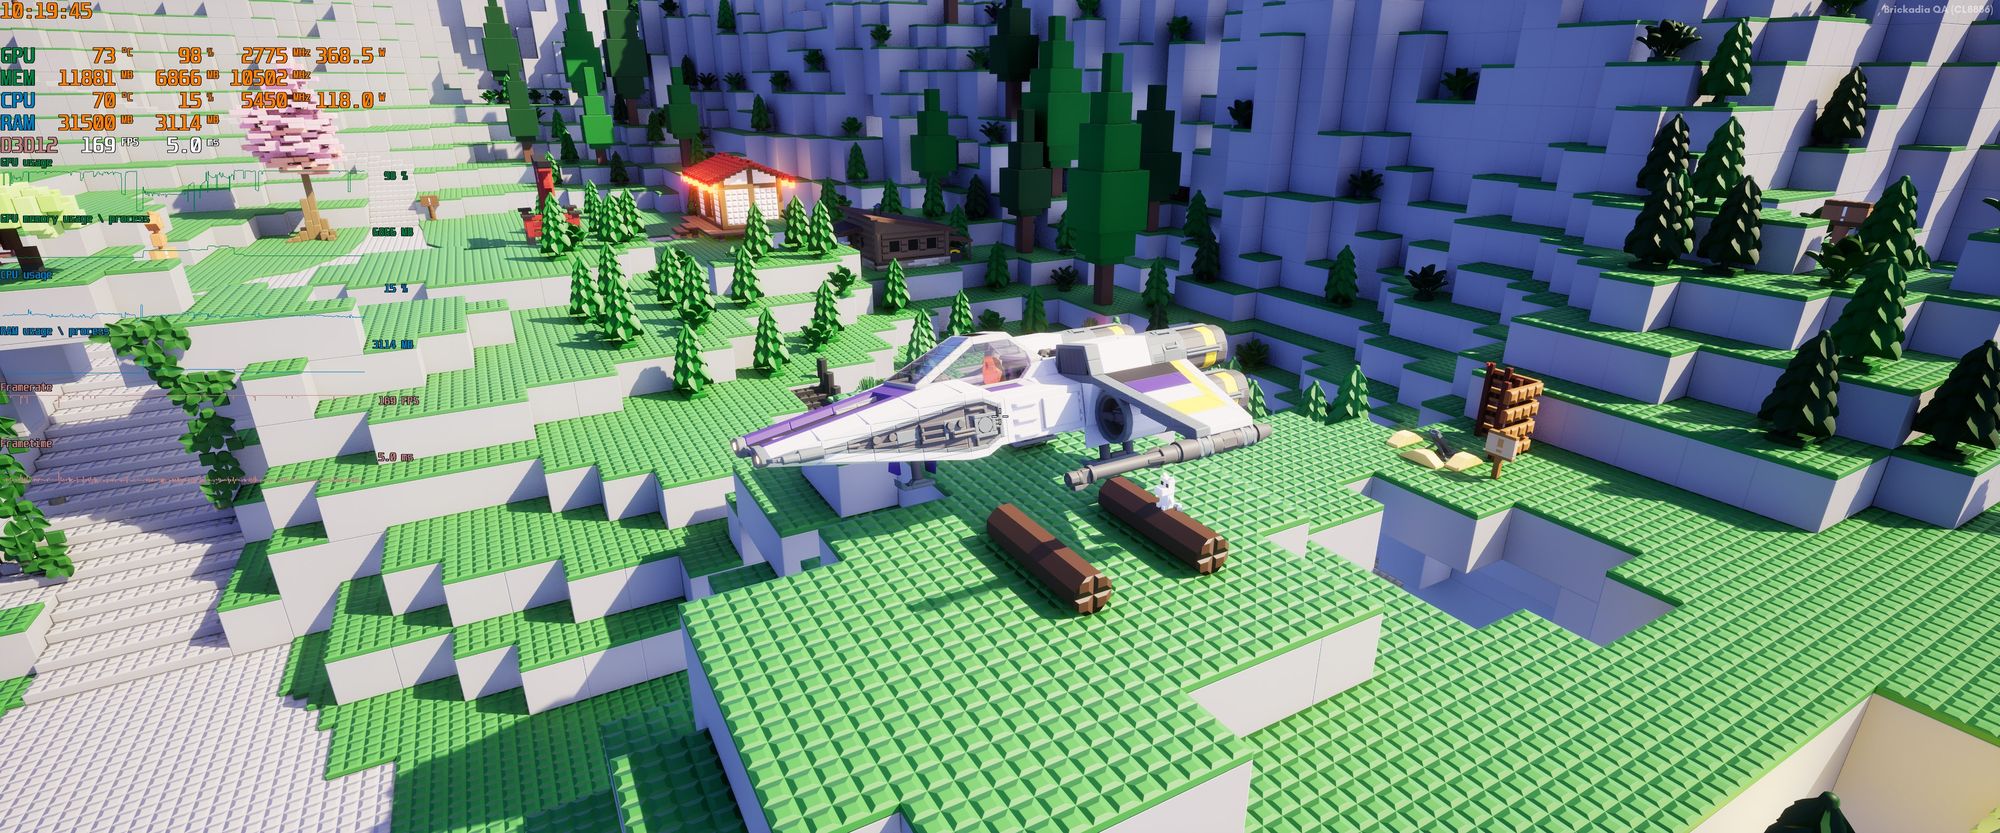
Wait, obviously I meant 2000 space ships. Otherwise what is even the point?!
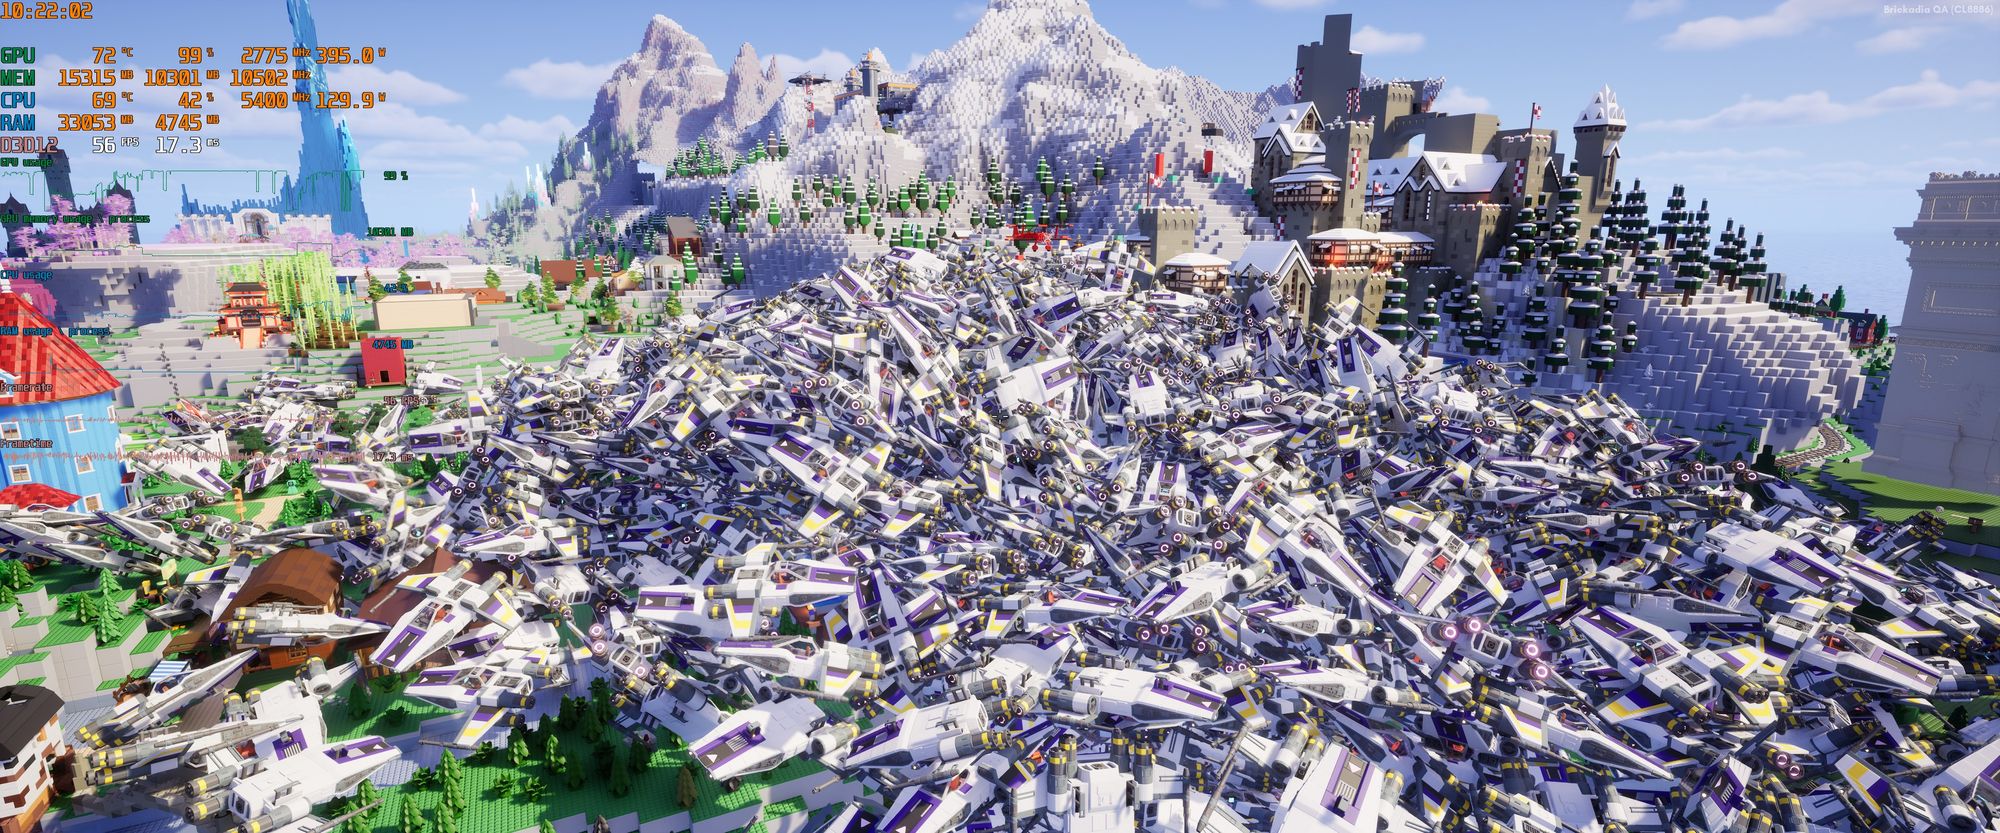
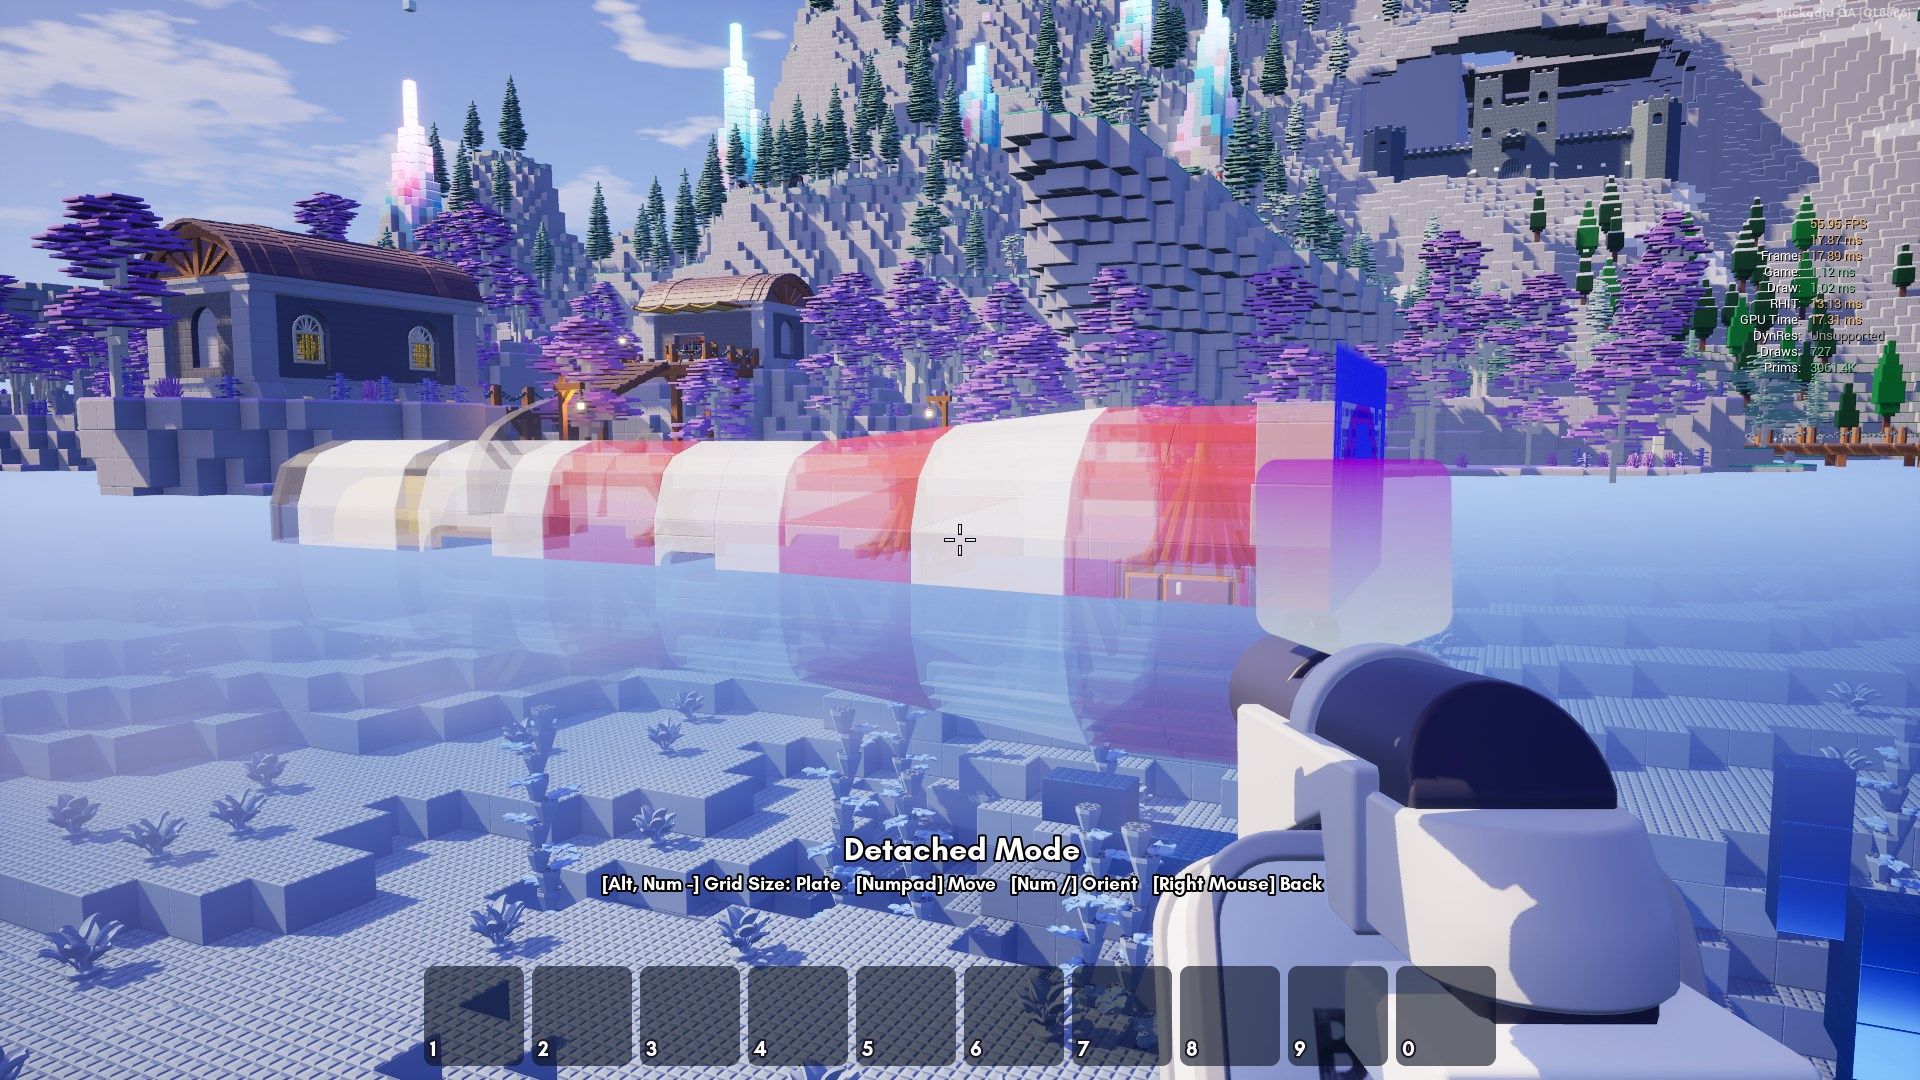
Our frame rate seems to have taken a bit of a hit. Let's enable DLSS 3 to fix it.
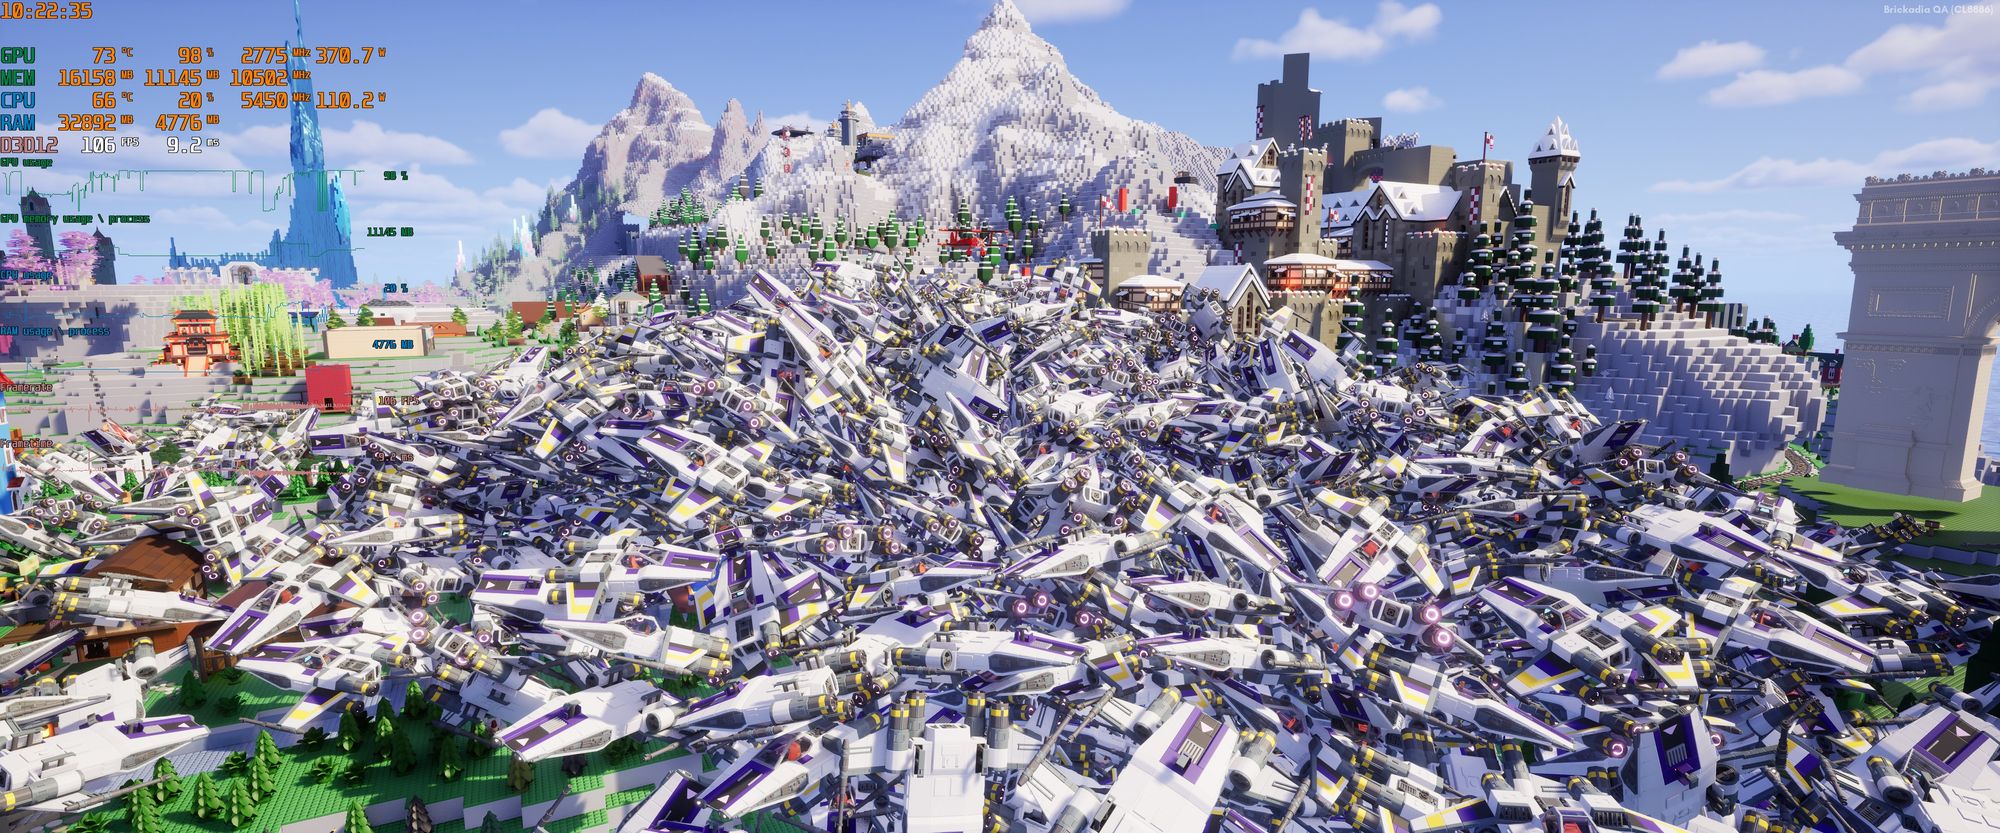
And there you have it! Some of the optimizations I have already planned for after launch will likely speed this up significantly without having to use DLSS 3, but for now this works very very well (if you can run it).
FSR 2 Upscaling
There are some goodies for people on AMD GPUs too! FSR 2 is AMD's counter to the DLSS 2 that we had during the Open Alpha, and has been released as a plugin some time ago. This replaces the temporal upscaling pass in Unreal Engine with a new, better one that works on more GPUs, and also works on the native Linux build. I don't consider the visual quality as good as DLSS, but it can definitely be a viable alternative to TSR with comparable performance.
Comparing these on a high end system doesn't really lead to meaningful differences in performance, they're all pretty good.


However, things change drastically when comparing them on the low end PC, combined with the usual graphics settings to keep our frame rate up.


With DLSS 2 and TSR-Ultra not usable on the GTX 1650, the fight is between the FSR 2 and TSR-Low, and FSR 2 definitely feels less blurry to me.
Unfortunately I can't show it to you in motion, as that would need lossless video for a fair comparison. This is very subjective, so your impressions might be different from mine. If in doubt, just try all the upscalers yourself.
What about FSR 3?
Now you might be thinking: Hang on, if I'm adding DLSS 3 Frame Generation, and FSR 2 upscaling, why not FSR 3 Frame Generation? It was just released also!
However, as far as I can tell in my experiments, this is just... not working?
To give it a fair test, I've used possibly some of the best gaming displays available: an LG UltraGear 38GN950-B and an LG OLED G3, set to 144Hz and 120Hz respectively, both G-Sync Compatible.
I've tried every possible combination of sync settings: G-Sync enabled on the display, or not, V-Sync enabled, or not, and combined these with the source frame rate ranging between 50 and 90. Can you imagine there wasn't a single case where it provided a good experience? In every single test, enabling it would introduce pacing issues that appear as slight to very visible stuttering.
V-Sync appears to be entirely unusable, despite the documentation saying that it works better using V-Sync. It was stuttering so much, I even tried to capture the screen at 144Hz to see what is going on. Stepping through that capture frame by frame revealed many frames that were just duplicates of the previous one, despite the game being capable of running much faster than that. Meanwhile, capturing the game running at 144Hz without FSR 3 enabled is perfectly smooth.
G-Sync is able to hide the terrible pacing somewhat due to its highly variable refresh rate, but it still doesn't feel smooth. For example, the game running at 65 fps with G-Sync actually felt better to play than the result of FSR 3 doubling that to 130 fps. The improved motion smoothness I can clearly notice from DLSS 3 is nowhere to be found.
So what's the problem? I have no idea. Maybe the plugin is broken. Maybe it's just incompatible with some other configuration. Maybe I just did it wrong somehow. But there's nothing I could compare it to and find out. If AMD wants to post a sample project that has it actually working nice and smoothly, like there is for DLSS, we can revisit this.
Improved Level of Detail Transitions
One graphical oddity I've seen a lot of people complain about (and complained about a lot myself) is how the low detail meshes we use for bricks absolutely destroy special bricks like trees at a distance. They'll have this really ugly and distracting popping effect if you fly over a large build.
But why does that happen? There are three main reasons:
- We group bricks into clusters for rendering, which means many bricks switch the level of detail together as a group, making it more noticeable on screen as a larger area is affected in a single frame.
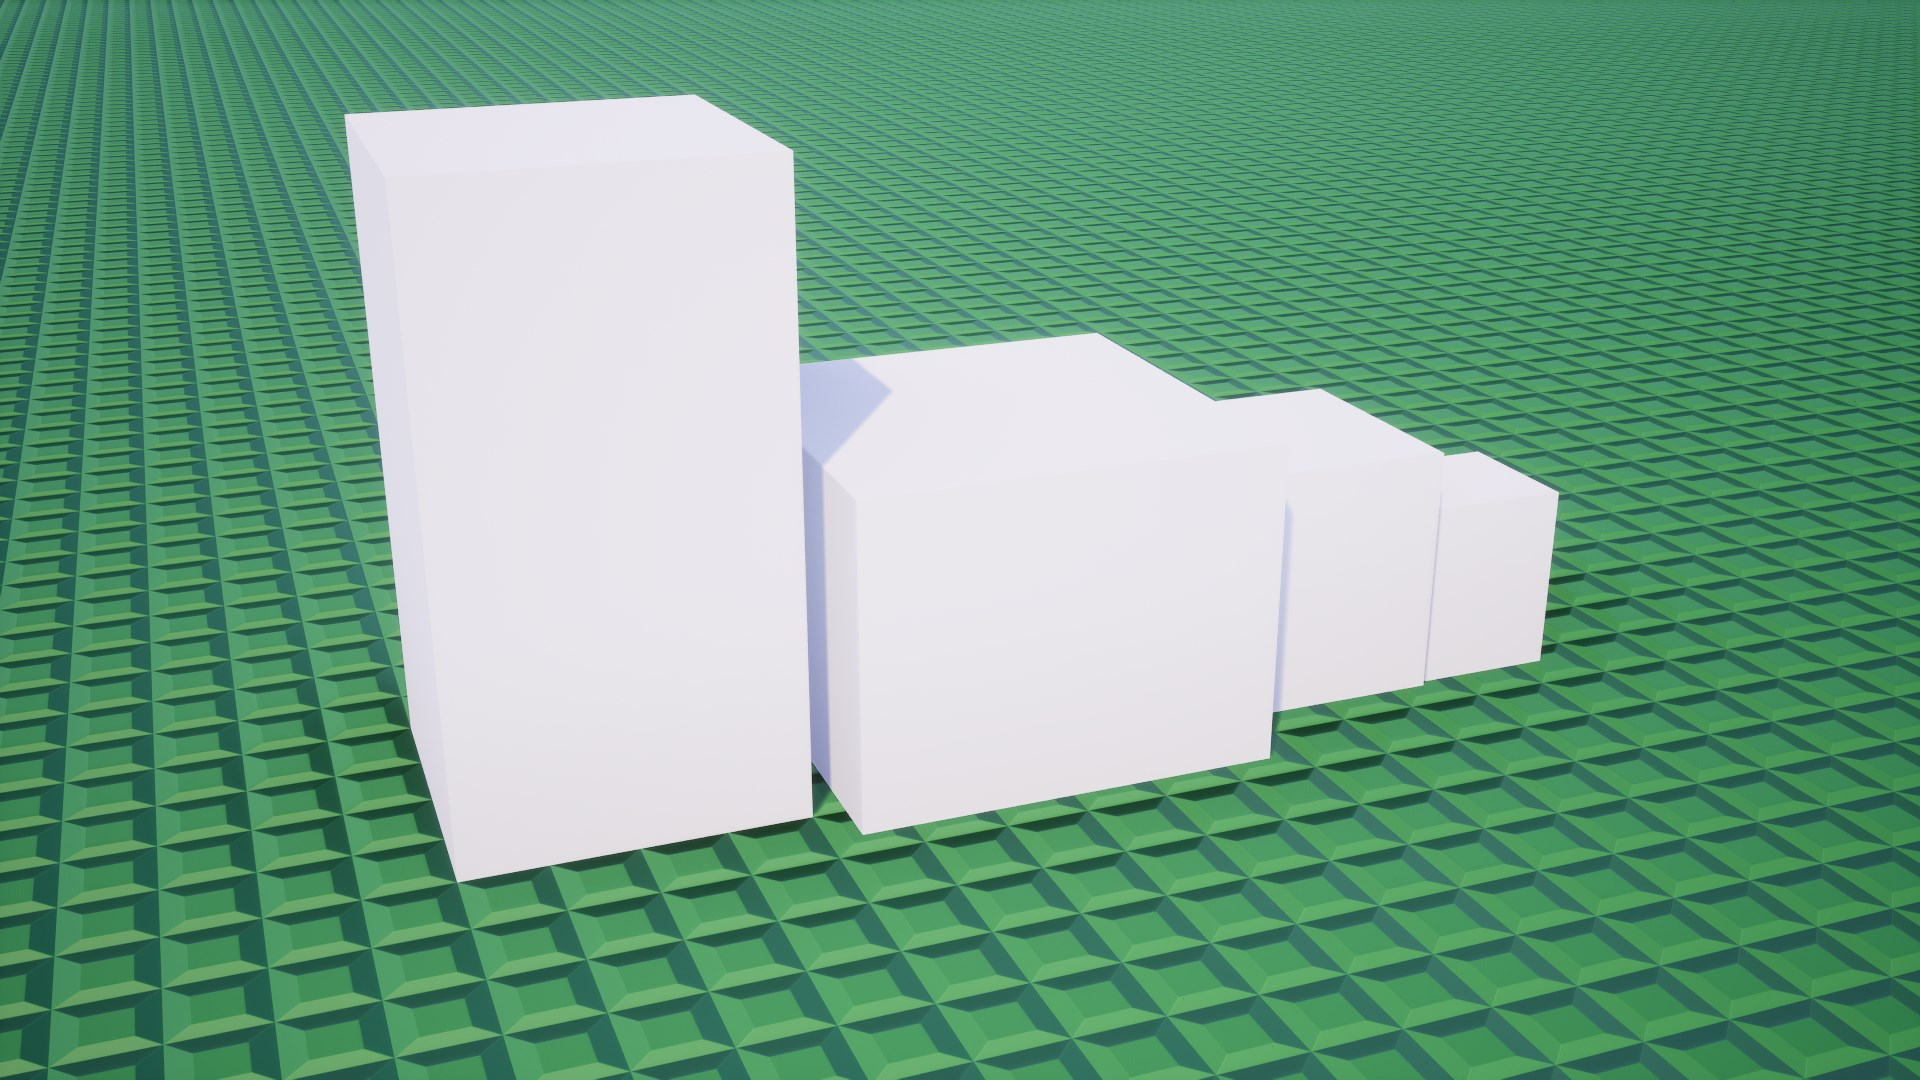
- The low detail version of special bricks is auto generated and absurdly bad. It's just a bounding box around the brick, often too large.
- There isn't any kind of transition, it just snaps from showing one version in one frame to another version in the next frame.
Now, we're not going to make any more major changes to the brick rendering system before release at this point. So we can't do anything about the first point. Bricks will continue to be rendered as clusters in the near future, at least until we get to a full Nanite integration some time during Early Access (maybe?).
But we can do something about the latter two.
Dithered Level of Detail Transitions
Unreal Engine supports transitioning between distinct levels of detail with a fade effect that lasts several frames. This works by temporarily rendering both versions, blending between them with a dither pattern.
It's quite badly documented, but here's how to use it for custom meshes:
- Enable the Dithered LOD Transition setting in all of the materials.
- Enable the bDitheredLODTransition flag on all your mesh batches.
- Make sure you have MaxScreenSize and MinScreenSize configured.
- Create separate static mesh batches for each level of detail.
Now if you went and done all of that, the result will be this unusable thing that is always flashing for one frame before the transition starts, because of course the feature is actually broken in 5.3. Watch closely and then you can't unsee it.
(These videos were taken from a newer version of the game, so the lighting is quite different. That's not relevant to this comparison, try to ignore it.)
After some investigation, it turns out someone had refactored a bunch of the code and accidentally taken it out of order - it was binding the dithered LoD state uniform buffer before regenerating it for the current frame, so it ended up combining the set of LoD models for the current frame with the fade progression of the previous frame (where the previous transition had already completed), resulting in a flash of nonsense for exactly one frame.
When I say "some" investigation, I actually mean it took all day to track this down, mostly because I was not familiar with how any of the code involved works.
Now we have smoother transitions, but it still doesn't really look good.
Improved Low Detail Brick Shapes
Take a look at some special bricks up close, and what they look like when rendered as low detail. You'll hopefully agree that this is quite suboptimal.
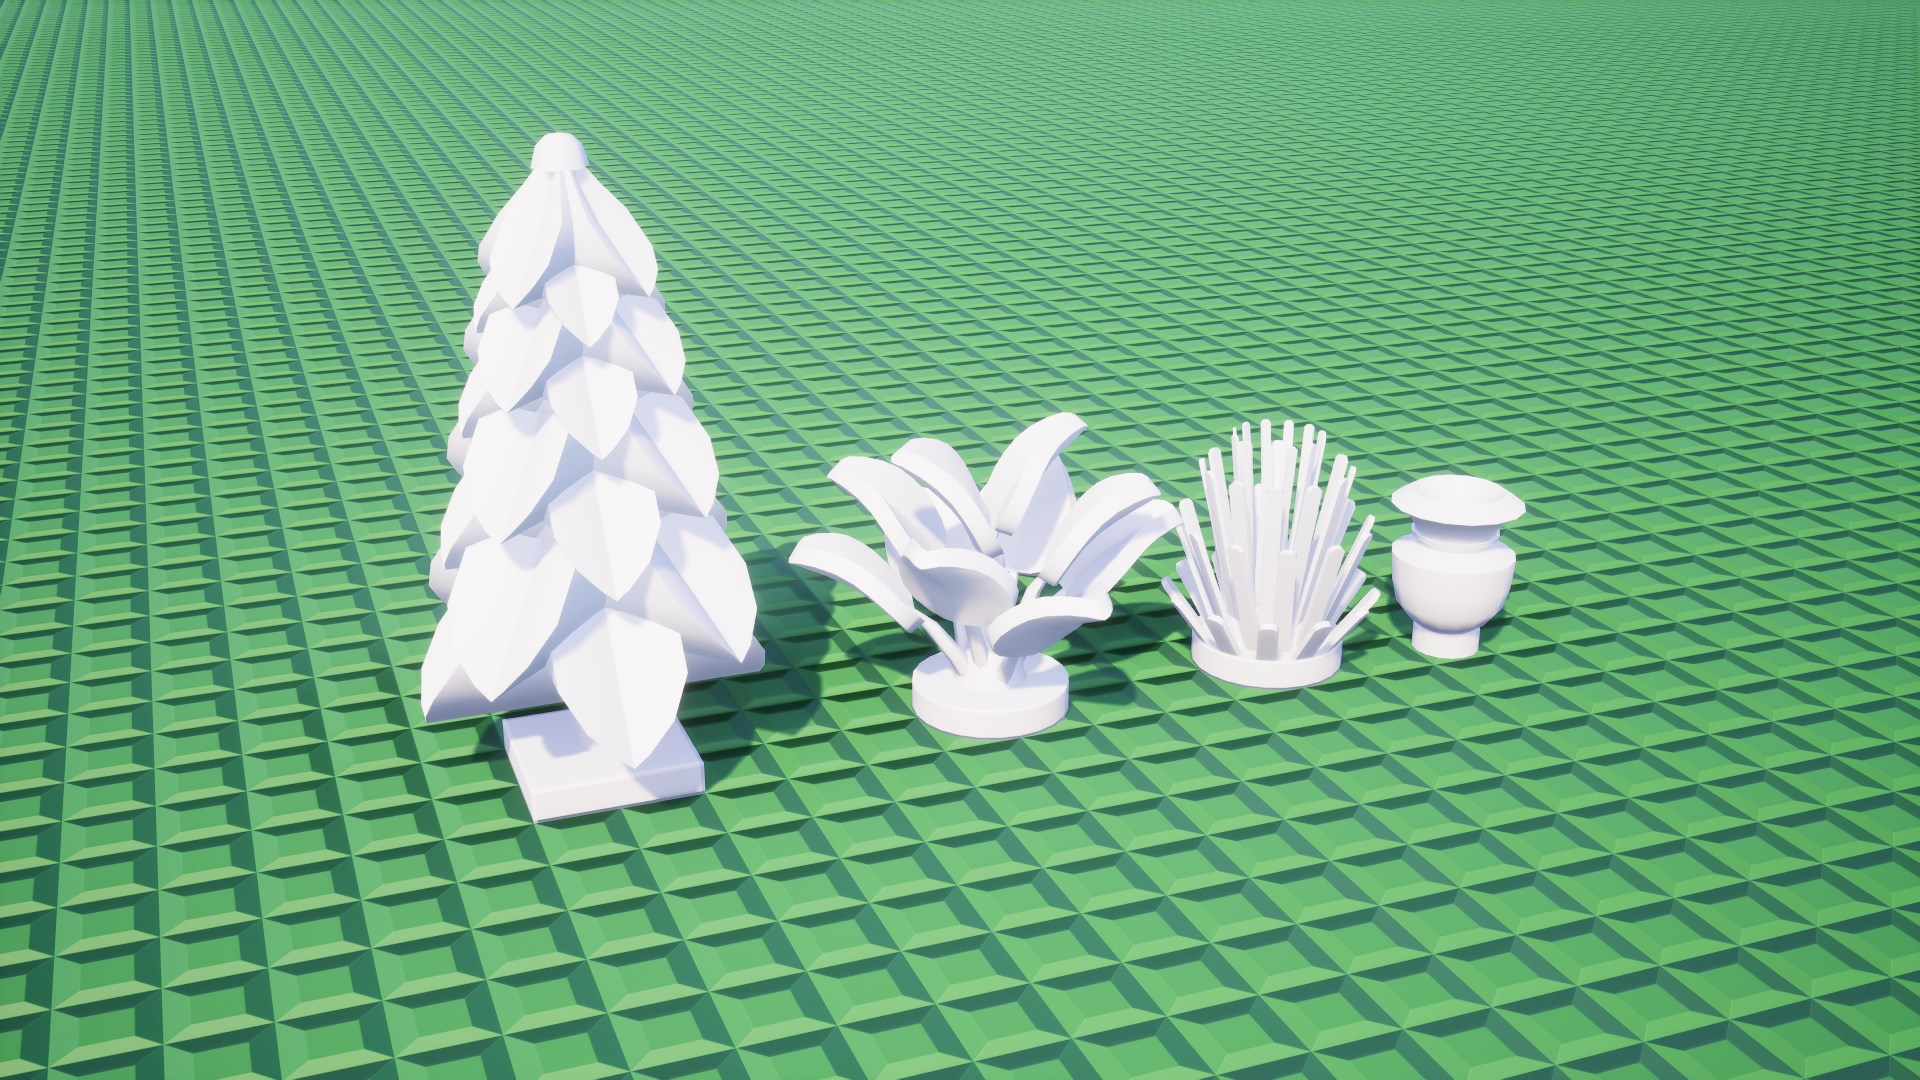
In a previous post I wrote a bit about generating convex hulls around collections of bricks. In hindsight, doesn't it seem quite obvious to use the same approach for generating more "snug" low detail versions of these bricks? Let's try that.
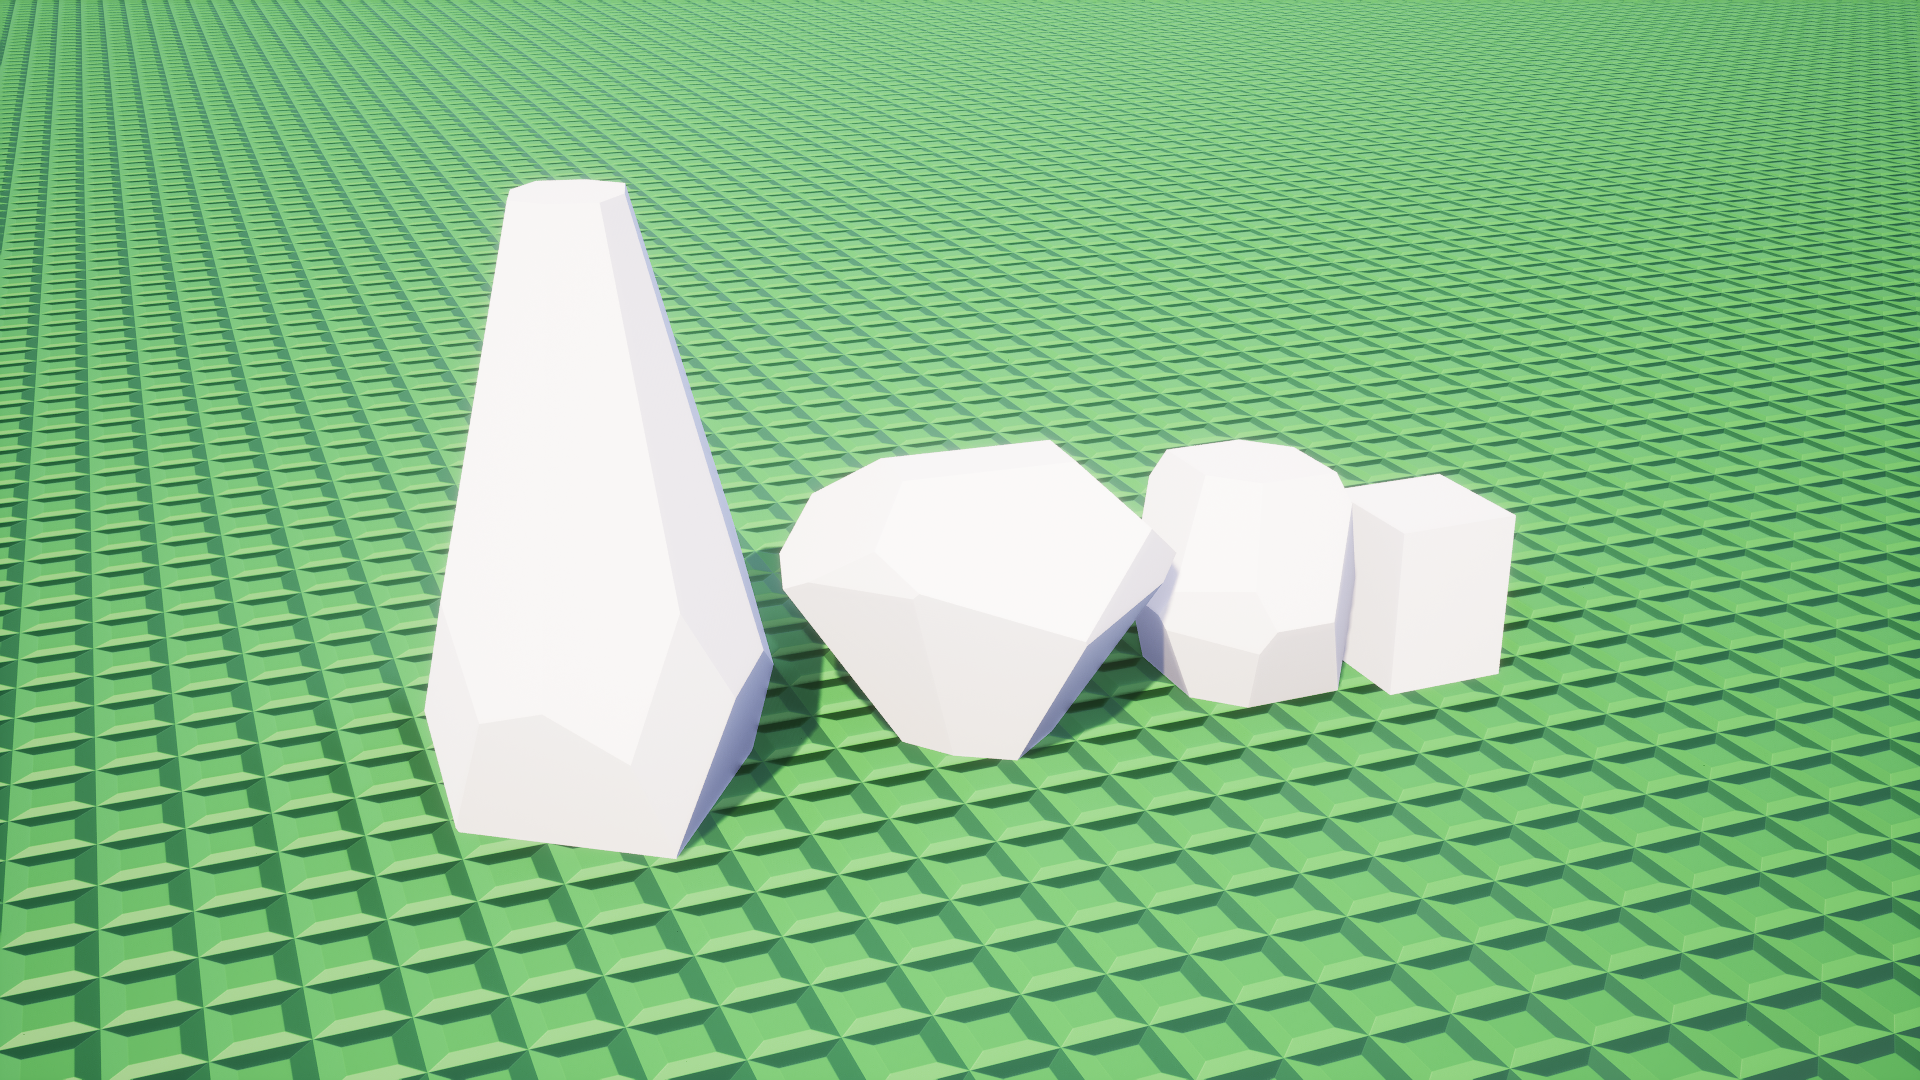
Much better! The new low detail shapes are less comically oversized, and also have face normals in directions more similar to the high detail version so the difference in lighting will be smaller. As a result, the transition will be less visible. We still want to use as few faces as possible, so for bricks below a certain volume like that jar on the right, those will remain a simple box.
Combining Both Improvements
Here is what the fly over looks like now, with both improvements combined. I think it's quite satisfying, virtually all of the popping has disappeared.
Let's do that again from a different angle.
What's Next?
I haven't been around much in the community this year, but our social media managers tell me these are your three most important questions:
- What happened to the networked physics?
- Why don't we write blog posts more often?
- When will you be able to you buy the game?
To be completely honest with you, progress has been slow. We still have little time to work on the game after our jobs. But we're still going, so there's no need to worry. I'm continuing my networked physics implementation right after I finish writing this post, and there will be another post on that as soon as it is ready to demo. Perhaps a Physics Trailer 2 too? There's been lots of hidden progress on Behaviors scripting, and Six is now working on revamping the building controls to work better for vehicles. You definitely won't have to wait another 6 months for updates this time, but some of these things have to cook for a while longer still.
Partly due to the things we have posted on here before, I have been hesitant to post something on this blog, unless I feel like we have collected enough stuff to make each individual post impress people somehow. It also takes quite a while to create these large posts, I just spent several days writing this one and getting media for it, which is all time not spent on actually adding more features to the game. But that means we sometimes go half a year without posting updates at all, so I can understand how that probably isn't what you'd like us to do...
Originally this blog was intended to just be posted regularly, every few weeks or so, with whatever curious things we did during that time and little polish. We'll try to get back to that for future posts.
As for the release date, I still can't tell you. We'd previously said "when it's done", and that is still the case. My best guess for when it might be done is now mid 2024. There are interesting events during that time, so it would align really well.
We will let you know once we are aiming for a specific date again, stay tuned.